Factor Trading – March 6th Report


NOTE:  All future such Premium Reports will NOT be publicly available.  To receive or view any of these Premium Reports in the future, you will need to be signed up on our free email list.  Please register using the form at the bottom of this report.


Market Review


Factor Moves are currently ongoing in:

  • Gold
  • Japanese Yen
  • USD/NOK
  • Copper
  • GBP/CAD

A Factor Move is developing in AUD/NZD. This issue of the Factor also comments on Canadian Dollar, New Zealand Dollar, Australian Dollar and U.S. stock indexes.

Factor Moves in Progress

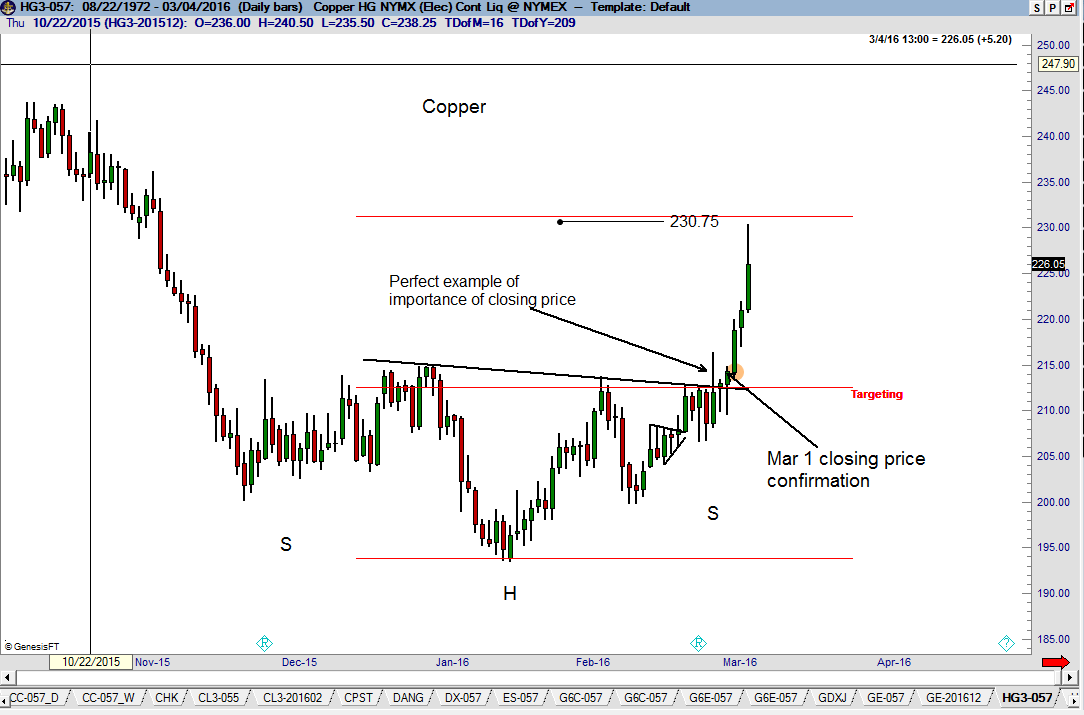
Copper (daily chart)

There are several observations worthy of note on the daily Copper chart. First, note the premature breakout on Friday, Feb 26. The market broke out of the H&S bottom, but the rally could not hold. Following a premature breakout traders should be on extra alert and jump on a subsequent closing price breakout. Second, the advance and close on Monday, Feb 29 and especially on Tuesday, Mar 1, confirmed the H&S bottom. Both days served as buying opportunities. Third, for all practical purposes the target was met by Friday’s advance. I typically am conservative on determining “measured moves.” Factor is flat, having taken a crazy ride on the long side this past week.


image 1

Read more

Gold – The Ultimate Charting Market – Report

Free 47-Page Gold Report

Japanese Yen is attempting to break out of a major H&S pattern.

A chart analysis of the forex markets

This post looks at the present forex markets through the lens of classical charting principles, as originally forumated in the early 1930s by Richard W. Schabacker, editor at the time of Fortune Magazine. Factor LLC is recognized as one of the world’s preeminent authorities on classical charting principles as applied to the futures and forex markets.

There are a number of forex crosses that indicate substantial trading opportunities for traders willing to hold positions for weeks or even months.

Before examining the current forex markets, a basic understanding of classical charting principles is approriate.

  • Charts simply show where a market has been, what it is doing now, and what the path of least resistance might be. Classical charting is simply an attempt to define market behavior in geometric terms. The real edge provided by classical charting comes from the marriage of risk management with well-defined geometric patterns.
  • There is no magic in price charting. Charts do NOT predict the future. Unlike some Elliott Wave adherents who attempt to label every zig and zag, I believe that the vast overwhelming majority of markets the vast overwhelming proportion of time cannot be understood through the lenses of classical chart principles (or any other method of technical analysis, including Elliott Wave Theory).
  • Well-defined chart patterns naturally provide opposite possible outcomes. A rectangle can complete in either direction. A rising wedge can become a running wedge. A symmetrical triangle can fake a trader out in more ways than imaginable. A H&S pattern can become a H&S failure. And on and on it goes.
  • Charts are subject to morphology. I do my best to always find a geometric explanation for price action. As a chart morphs it can be subject to different geometric construction. As a general rule, intraday charts morph more often than daily charts, daily charts morph more often than weekly charts. But, more often than not a market cannot be explained easily by geometry. It is then time to find another market. This is why I might be focused on Robusta Coffee one day and some foreign stock index another day. I want to focus on markets I can define geometrically.
  • Reliable chart trading is cyclical. There are periods during the year (an average of two periods lasting two or so months each) when an unusual number of markets form well defined patterns AND the markets respond to those patterns in predictable fashion. Using language of farming, this is time to make hay. During the other periods we rely on aggressive risk management to limit our losses and keep out pile of chips somewhat intact.
  • It is a thing of beauty when classical chart configurations work. It is a thing of frustration when they do not work. It is a thing of confusion when the majority of markets defy definition from a classical charting perspective.

A review of selective forex markets

Eurocurrency (EUR/USD)

The long-term trend (as featured by the 45-year trendline) in EUR is under threat, as shown by the quarterly graph. The dominant chart construction is the 6-1/2 year descending triangle completed in Jan 2015. This pattern has a target of $.84. Such a decline would likely be accompanied by a massive change in the European Currency Mechanism (ERM).

2.7_EUR_Q

Read more

The U.S. stock indexes are NOT making H&S tops!!!

Xmas tree H&S


Note: The post herein was absolutely wrong on the analysis of the H&S top in stock indexes. Guess what — traders are wrong from time to time. I make bold calls and some are right and some are wrong. At the end of the day, price is king and nothing else matters. Members of the Factor research service know that I over-rode the analysis herein on January 6, cautioning that the stock market had deep internal trouble.

Classical charting principles have rules. The Head and Shoulders is a classical chart configuration. The apparent and well-advertised H&S top in the U.S. stock indexes do not meet the rules.

Perma-bears, a H&S top is not sitting for you under the Xmas tree!

Sorry to all of you stock market doomsayers, but labeling the U.S. stock index charts as H&S tops just does not work.

Volume is an important criteria upon which to judge the validity of the H&S patterns. Richard W. Schabacker (Technical Analysis and Stock Market Profits), and later, John Magee and Robert Edwards (Technical Analysis of Stock Market Trends), are considered the pioneers in classical charting principles. According to the founders of classical charting, as a rule volume should be greatest in the left shoulder or head and lightest in the right shoulder in order to validate a H&S pattern.

As the charts of the Dow Jones Composite, Dow Industrials and S&P 500 show below, the largest slug of volume has been in the right shoulder. This is NOT a sign of a valid H&S pattern, thus the interpretation of a H&S top in the U.S. stock index charts is not likely to be correct.

12.23_DJIA Read more

The Chart of the Month — MSCI World Index building a top??


MSCI World Index forming a massive 2-year H&S top

The MSCI Index appears to be rolling over in a right shoulder of a significant top pattern. One must be blind not to notice the similarities between this potential top and the chart top completed in 2008. Also, notice how the right shoulder held at the 6+ year trendline. The completion of the H&S top would also violate the trendline. A completion of this top could lead to a decline toward 1400.

MSCI


But I am NOT a doomsayer. In U.S. stocks I am NOT a bear and I am NOT a bull. In fact, I believe the S&Ps will remain in a range of 10% above the recent high to 10% below the recent low for the next five to eight years.

12.14_SPX Read more

A chart analysis of the Swiss Franc


Charts indicate that the USD/CHF could trade at 1.1200 and perhaps as high as 1.2350.

Swiss National Bank is intent upon driving the Franc lower (i.e., USD/CHF higher)


Note: This report represents the type of analysis routinely provided to members of the Factor Service. Members of the Factor Service have been advised for three weeks to be long USD/CHF. For information on the Factor Service, click “Subscription” on the upper menu bar. The membership rate for new members to the Factor Service will be increased by $100 per year beginning January 1.

When analyzing the charts of a commodity, stock or foreign exchange pair, it is always best to start with a long-term view and work towards the shorter-term.

The 100-year chart of USD/CHF shows that the USD is extremely cheap in historical relationship with the CHF, as shown below. Market observers who believe the USD/CHF cross is overheated do not have a clue. The clueless bunch were screaming “overbought” on USD/JPY back in Jan 2013 when the cross was under 90 to 1, on its way to 123 to 1.

USD.CHF 100 years Read more

Live Cattle charts confirm a major top

A major top has been confirmed on the Live Cattle price graphs, projecting significantly lower prices.

The weekly continuation graph completed a 14-month H&S top on Aug 21. The general target of this top is sub-120.
9.16_LE057_W

Read more

The bearish case in Silver is back on the table

Seven month symmetrical triangle has been confirmed

Decline on August 25 triggerd an 8-week H&S failure

In recent weeks I have presented to members of the Factor Service the possibility that  why The Silver chart is a textbook example of the veracity of classical charting principles. Some of the features on the weekly graph include:

  • The blow-off top in April 2011 accompanied by record blow-of volume
  • The rising wedge retest of the top completed in September 2011
  • The continuation H&S pattern completed in April 2013
  • The descending triangle completed in September 2014
  • The symmetrical triangle completed in June 2015

8.26_SI_W Read more

A preview of the August 23 Factor Update — S&Ps

Initial draft of the S&P section of the upcoming weekly Factor Update

[Note: Each week Factor LLC issues a chart analysis of the markets in which it carries a position or is considering a position. The following is the initial draft of the analysis of the S&P 500 for this weekend’s Update. To become a member of the Factor Service, click here or the Subscription tab in the menu bar.]

S&Ps

[Subject to change pending the close on August 21, 2015.]

The morphing referred to in recent Updates may be over. The decline on Thursday completed a near perfect 8+ month complex H&S top. I consider the top to be complex because each component is multi-faceted. There is a double left shoulder; the head is an independent H&S pattern; and, the right shoulder took the form of a horn or sloping top. The horizontal nature of the neckline adds to the potential power of this top. The initial target of the H&S top is 1937, although support in the area of the Dec and Jan lows at 1970 could provide a short-covering rally. On a daily basis the current decline seems to be overdone. Yet, on a weekly chart the current decline is nothing out of the ordinary. A retest of the Oct 2014 low would be 1813. On a worst case scenario, a decline could retest the Jun 2013 breakout of a multi-year rectangle at 1600. Factor is short. I attempted to add to the position on Friday with a limit order at 2033, but I was fishing behind the net. Note: Had I added a layer of shorts at 2033 today I would have covered it at 2003.

8.21_ES_D

8.21_ES_M

8.21_SPX_Q

Other markets currently considered for the August 23 Factor Update include $AAPL, US Dollar/Chinese Yuan, Mexican Peso, Natural Gas, Crude Oil, EUR/USD, Silver, Gold, Soybeans, Live Cattle, T-Bonds and NZD/JPY. The August 23 issue will also have commentary of the most common mistakes made by novice traders and on the dangers of trading the 24-hour markets.

###

Afraid to short S&Ps because it is oversold?????


Traders become accustomed to the recency and expect recency to extend indefinitely

S&Ps have sold off 60 points in just two days. Only fools would short a market that is so deeply oversold.

8.20_ES_D

But is the market really oversold?? Really?????????

8.20_ES_W_v2


I am not predicting a top. I trade possibilities, not probabilities, and definitely not certainties.

$ES_F, $SPX, $SPY