
Has a new bull market in Gold begun?
Gold is the purest charting market of all. The Gold market always rings a bell at major turning points. Gold has been in a bear trend since the 2011. Well, guess what …
[Note: Factor has maintained a “History of Gold Charts” document for years — showing how Gold has reliably responded to classical charting princip les. An updated version will be issued soon. Look out for the announcement that the Update is available.]
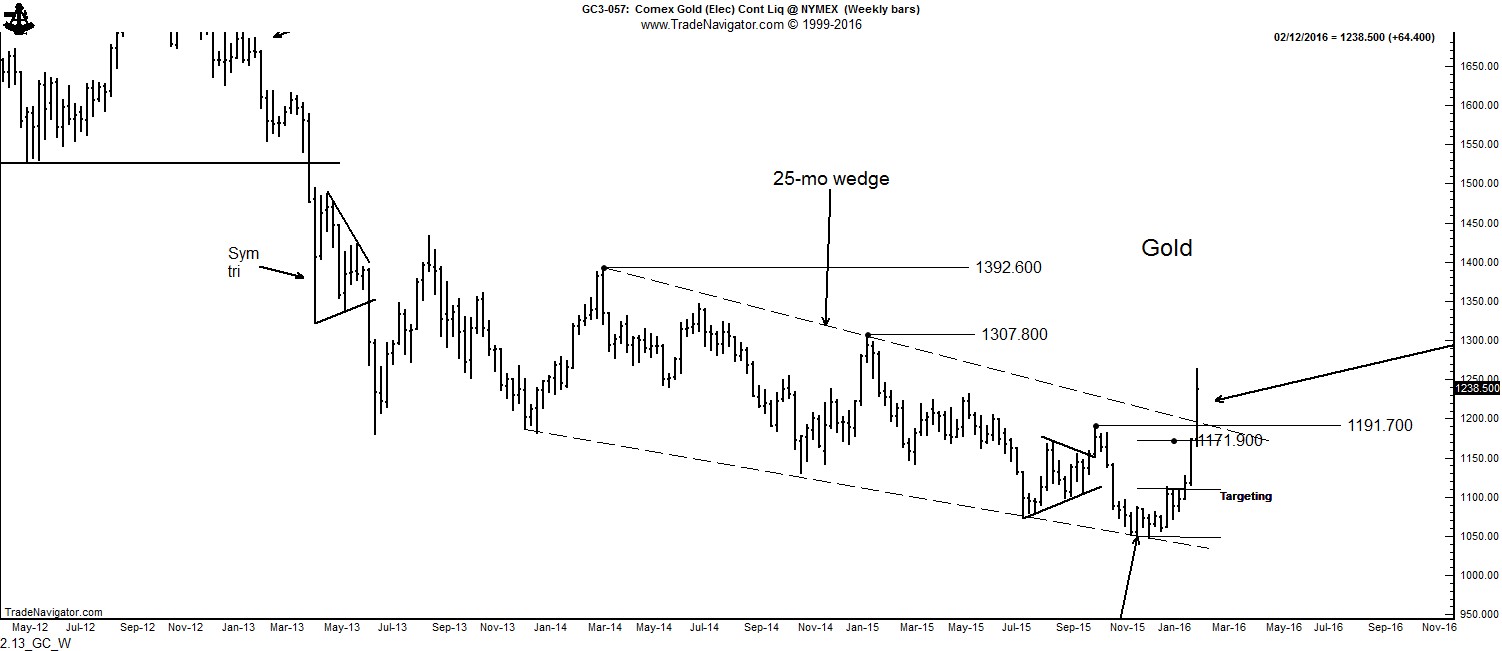
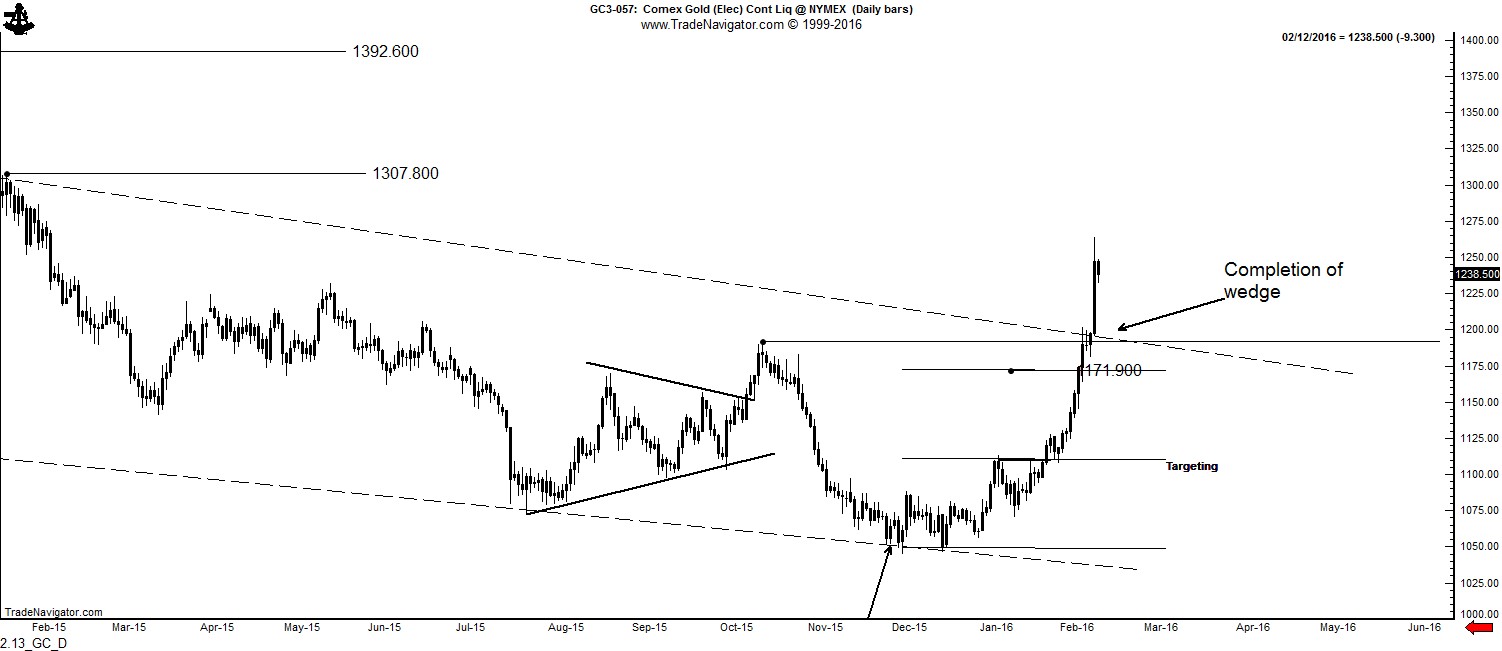
The advance this week blew through the upper boundary of the 25-month wedge on the weekly and monthly Gold graphs. This price action confirms that the bottom in Gold is in place. Falling wedges do not normally lead to a strong and immediate up thrust. More typically, prices either retest the wedge or stair-step higher. However, a strong thrust is entirely possible and cannot be ruled out. The targets of the wedge are 1307 and 1392. I would be most interested in being long Gold on any pull back toward 1200, but I am not sure the market can pull back this far.
Silver met its target at 1555 — this is the first daily chart bottom that has met its target since 2011 and represents a change in the price behavior of the metal. Silver has also “poked” its head through the upper boundary of its falling wedge, but not decisively. My guess is that the Oct 2015 high might represent a challenge for Silver.
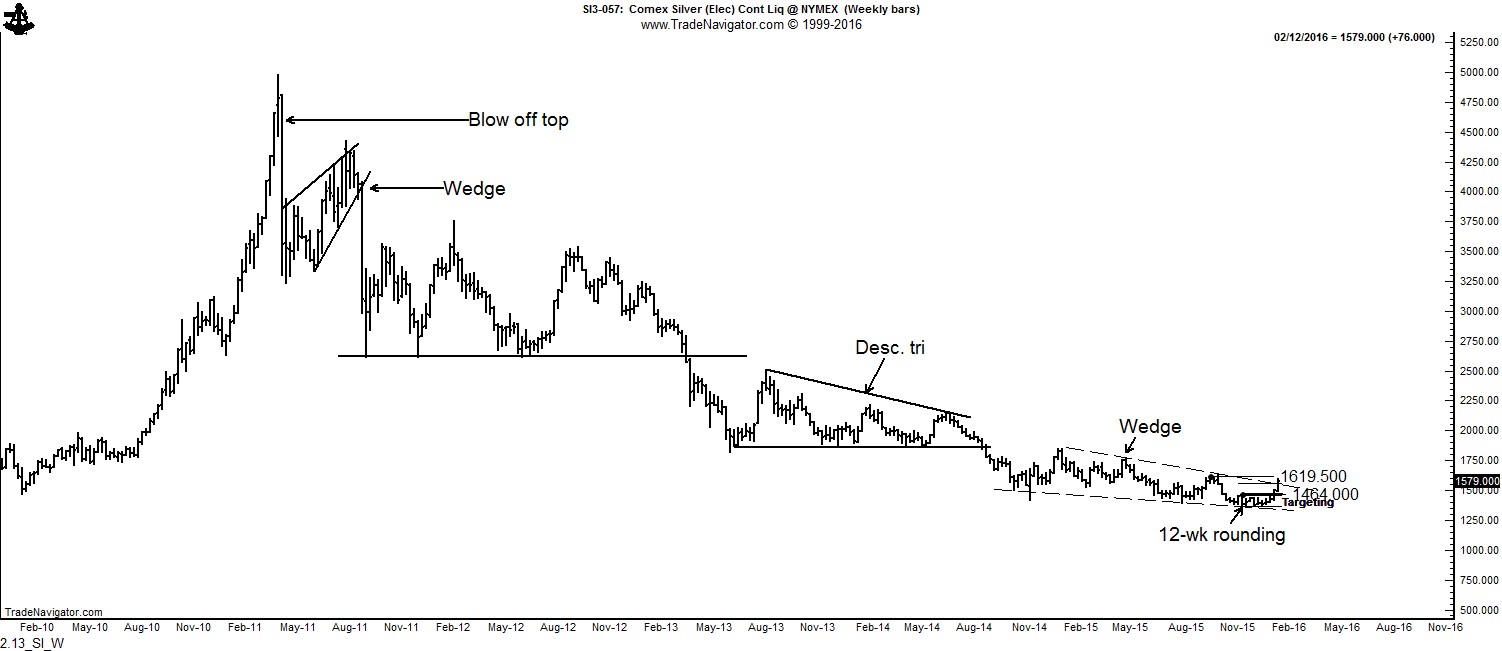
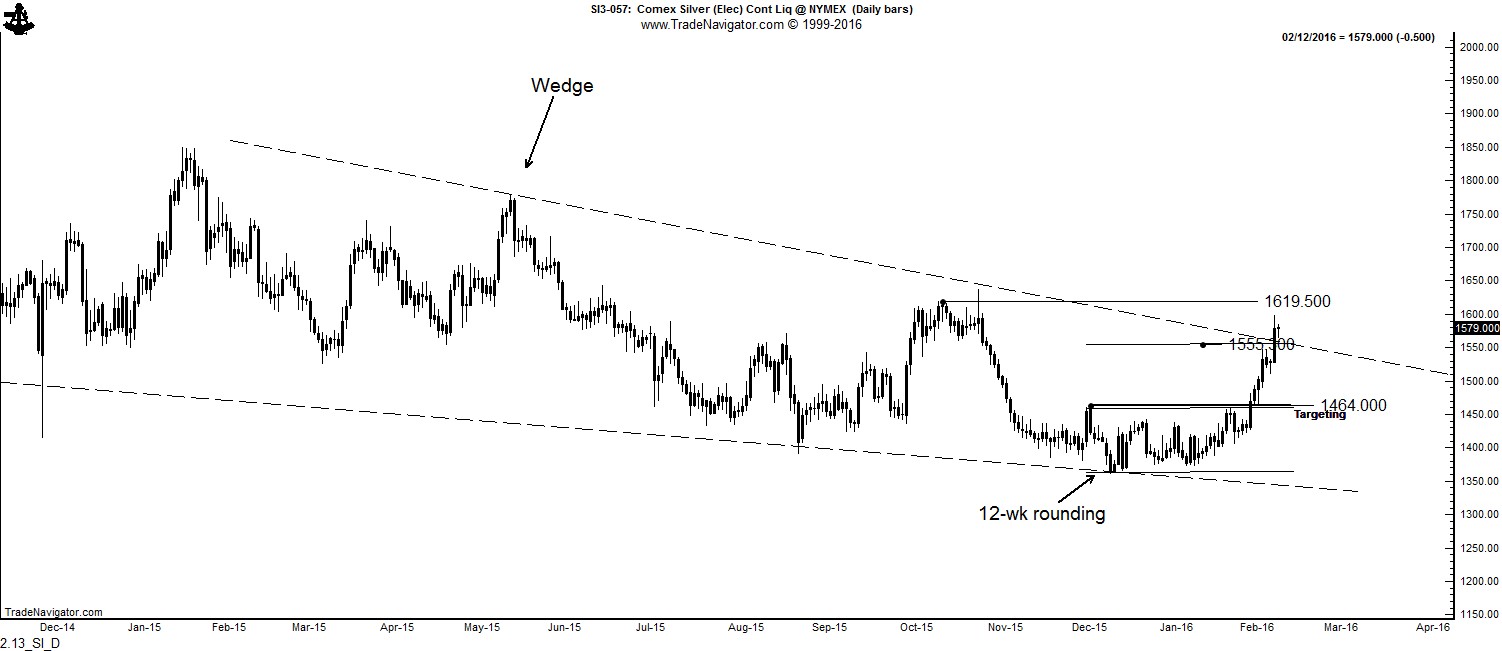
Silver is extremely cheap relative to Gold with a Gold/Silver ratio close to 80 to 1.
plb
###


