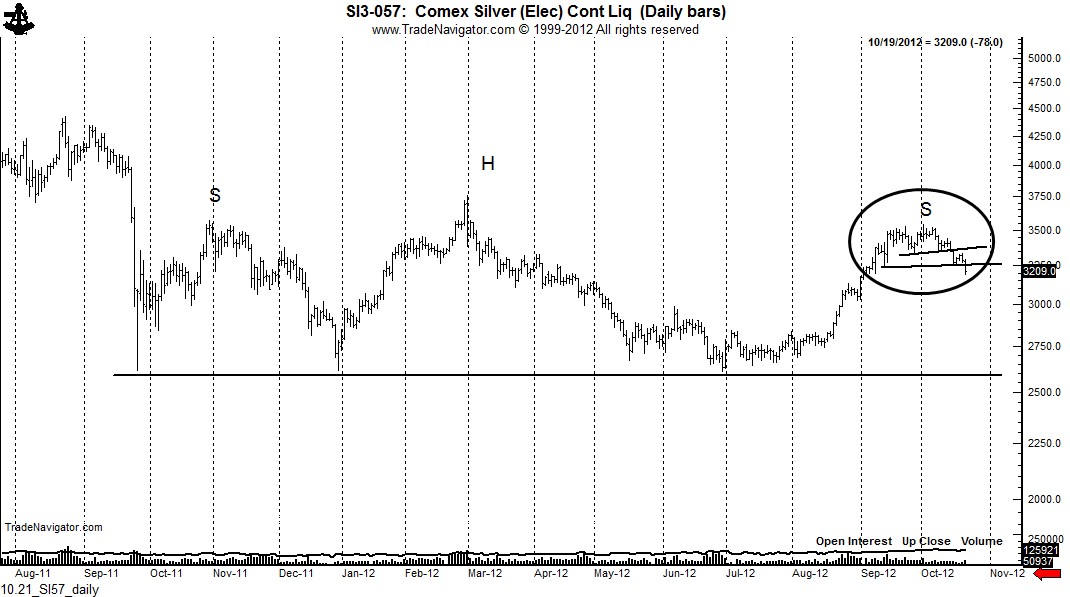
Silver is forming a massive Head and Shoulders top
A restest of the neckline at around $26 is likely, what happens after that could be historical.
The daily chart of Silver futures is forming a massive 13-month H&S top pattern. The neckline of this pattern at $26 is the likely downside target of the current sell off.
Also, note that the right shoulder high of the massive H&S pattern took the form of double H&S tops of 5-weeks and 7-weeks of duration. The right shoulders of both of these smaller patterns were abbreviated. As a general rule, H&S patterns with abbreviated right shoulders tend to be quite reliable.
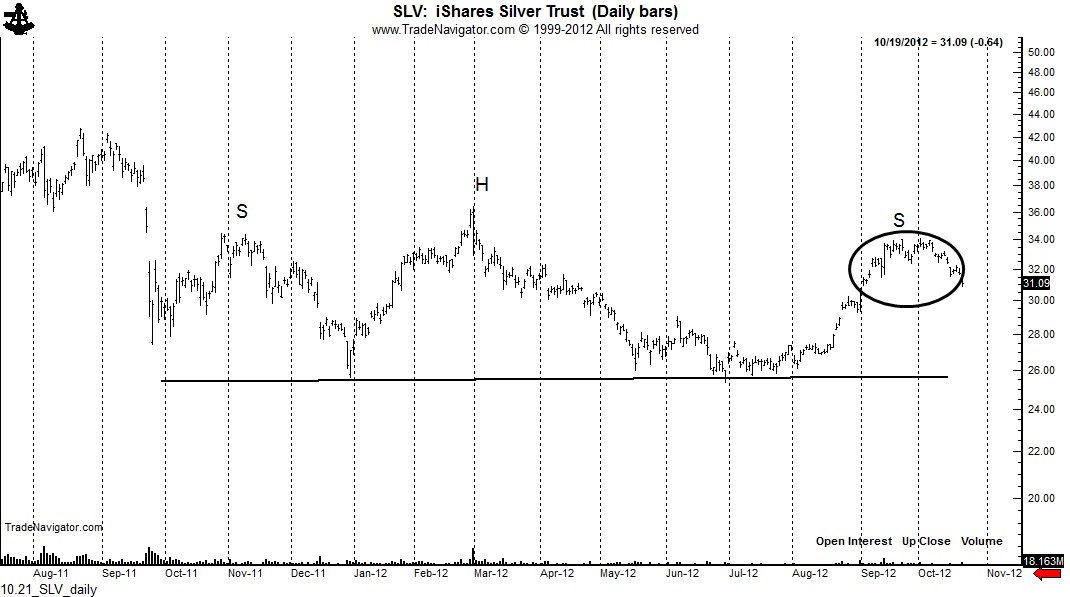
As one would expect, the chart of $SLV (etf) is quite similar in form.
Markets: $SI_F, $SLV
###


Trackbacks & Pingbacks
[…] Businessweek HSBC forecasts “glittery future” for Gold next year – BullionStreet Silver is forming a massive Head and Shoulders top – Peter Brandt What is China really doing in the gold markets? – Mineweb Action Step: […]
Leave a Reply
Want to join the discussion?Feel free to contribute!