Stock Market Retesting Breakout Points
Let me start tonight by reminding everyone what this blog is and is not intended to accomplish. I am NOT an analyst. I have no vested interest in being a bull or bear in the stock market.
This blog simply presents major chart patterns that I recognize in the process of my own trading. I have honestly admitted that I am profitable on far less than half my trades. I have no desire to earn a reputation as a guy who was super bearish on the stock market when it tanked. I have no desire to be known as the guy who was super bearish on the stock market when it did not tank.
I care far more about making money than about being right. I believe that trade selection is the most over-rated component in the trader’s toolbox. Profitable trading is about grinding it out, not about throwing Hail Mary passes into the end zone.
I also went on record last night and early this morning as admitting I was not in sync with the stock market. I said this to highlight the struggles of a trader, not to make an excuse as an analyst (which I am not).
With this background taken care of, let me start by saying that absolutely NOTHING has occurred to make me one bit less bearish than I was on July 29 when I posted my first major piece predicting the decline that then occurred. If anything, the magnitude of the decline has made me more bearish because we now have completed chart tops and we now know how vicious a decline can be.
But, especially for those of you who are novice traders, a distinction must be made between one’s opinion and one’s position. The two can be quite different. So let me start my analysis from the beginning of this move.
I traded the E-Mini S&P futures during this decline. In my parlance, I built a position that was three layers deep. I sold short on 7/29 at 1273.75. I added the second layer at 1253 on 8/2. I shorted the third layer at 1258 on 8/4. I announced these trades in real time via this blog or Chart.ly.
It was not difficult staying with this trade initially because despite the sharp declines early on there was so much talk through the online trading communities about buying for the bounce. This gave me confidence my trade was right.
My target was 1155. I covered the first layer at 1155 on 8/8. I questioned that decision aloud in this post — not to second guess myself but as a way to describe the emotional tugs a trader faces. My trading rules specify that I take some profits at the target. I covered the second layer on Monday night at 1121. I remain short the third layer with an open profit of nearly 90 S&P points (as of this writing). There is no way I can lose money on my S&P campaign. Even if the market returns to a bull trend I will be stopped out with a net gain. However, the market remains 500 S&P points from the target, so my only thought now is on extending my leverage.
Let’s review the market behavior. Nothing has changed! Major sell signals were flashed around the globe. The S&Ps remain 70 points below the breakout. I doubt this index will retest the H&S top. Unless the S&Ps can move above last week’s high, I am pretty certain the market is headed to a test of the March 2009 low. How it gets there is another story.
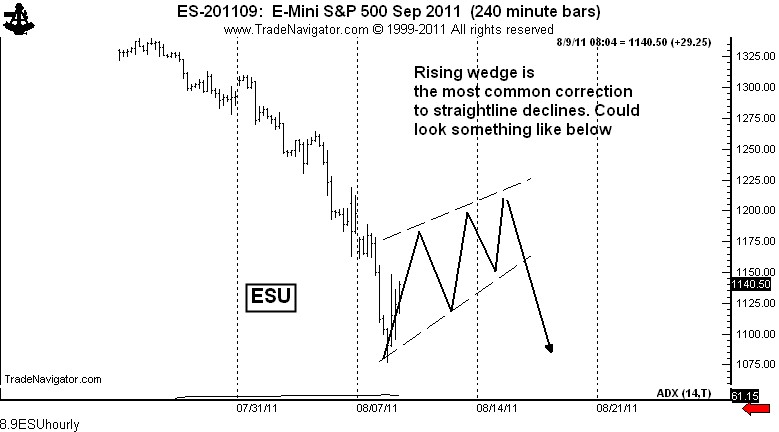
I want to re-established the short layers I covered. The question is where. This morning at 10:00 AM I posted the following graph on Chart.ly, taking a wild guess at the retest rally yet to come. The chart I posted is shown below.
This chart shows the S&Ps rallying back to 1210 or so. I doubt it can get much higher and I am willing to re-sell one layer at that level. Why that level? I have no idea — I don’t measure retracements, never have, never will, no desire to do so. If you make money with retracements, I cheer for you. I do think the retracement rally will take the form of a wedge or flag.
I am keying off the Nasdaq to fine tune increasing my size in the S&Ps. I think the S&Ps will be weaker than the Nasdaq, with the DJIA the strongest of the three major indexes. The Russell is also a good shorting candidate, but I started with the S&Ps so I will stay with this index.
Let me conclude with the Nasdaq.
My entire trading in the stock index markets (and all other futures markets and stocks) has been according to the principles laid out in a 1948 book titled Technical Analysis of Stock Trends, by Robert Edwards and John Magee. In turn, Edwards and Magee borrowed their observations from Richard W. Schabacker, who was the father of classical charting.
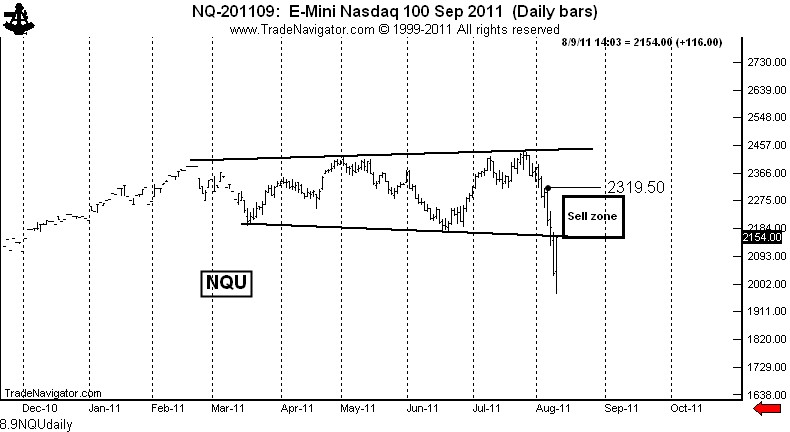
I believe Edwards and Magee would describe the Nasdaq 100 as having completed a 7-month broadening top. See below.
So, rather than me commenting on this pattern, I thought I would quote directly from Edwards and Magee (Fifth Edition).
“…chart pictures of this type [broadening] make their appearance as a rule only at the end or in the final phases of a long bull market.”
“We have come to the conclusion that they are definitely bearish in purport.”
We are in a retest of this top. Following are comments from Edwards and Magee regarding the retesting process.
“A development typical of broadening tops — a pull-back rally retracing about half of the ground lost between the last pattern top and the end of the initial breakout move. Such a recovery (and failure) will be attempted, according to our experience, in at least four out of five broadening top patterns, and may not fail until it has regained two thirds of the preceding decline, although it usually peters out around or even below the half-way mark.”
With this in mind, and using the July 26 high and August 9 low as reference points, the retest rally should stall somewhere between 2150 (the lower boundary of the pattern) and 2277 (two-thirds recovery). I realize this is a big range. Sorry folks, nobody ever said this was easy. My thinking is that the rally will fizzle out between 2150 and 2200.
If my trading vehicle was the Nasdaq, I would consider selling around 2170, but money management is always my primary consideration. My maximum risk per trade is 100 basis points, and I average closer to 60 basis points. On the S&Ps trade my maximum risk was 150 basis points. I would want some signs of a top before I leaned heavily into a short position. Even when I lean heavily into a position (in terms of sizing), I don’t take a greater risk — it’s that I can fine tune an entry.
Anyway, I think this is where are at. I remained convinced that the stock market has topped.
Now, on to some rather ugly business. I am aware that some of you shorted the stock market in the hole, and worse yet, some of you have taken refuge for this mistake under my bearish comments. In reality, you followed my comments during the entire decline only to get short near the bottom. I have no advice to give you other than to point out you made a stupid trade. It is NEVER wise to chase a market, and it is stupid to chase a market that is in a state of panic.
The time to have gotten short was between July 27 and August 3. Even someone who sold the breakout in the Nasdaq on August 5 could have used a break-even strategy.
I encourage you to develop your own unique style of trading. There are no short cuts to profitability. Ultimately all novice traders need to “own” their own results.
Markets: $QQQ, $QQQQ, $PSQ, $NQ_F
###


Leave a Reply
Want to join the discussion?Feel free to contribute!