Tag Archive for: ES_F

stock market updates - Factor Trading - Peter brandt

Stock Market Updates

Stock Market Updates

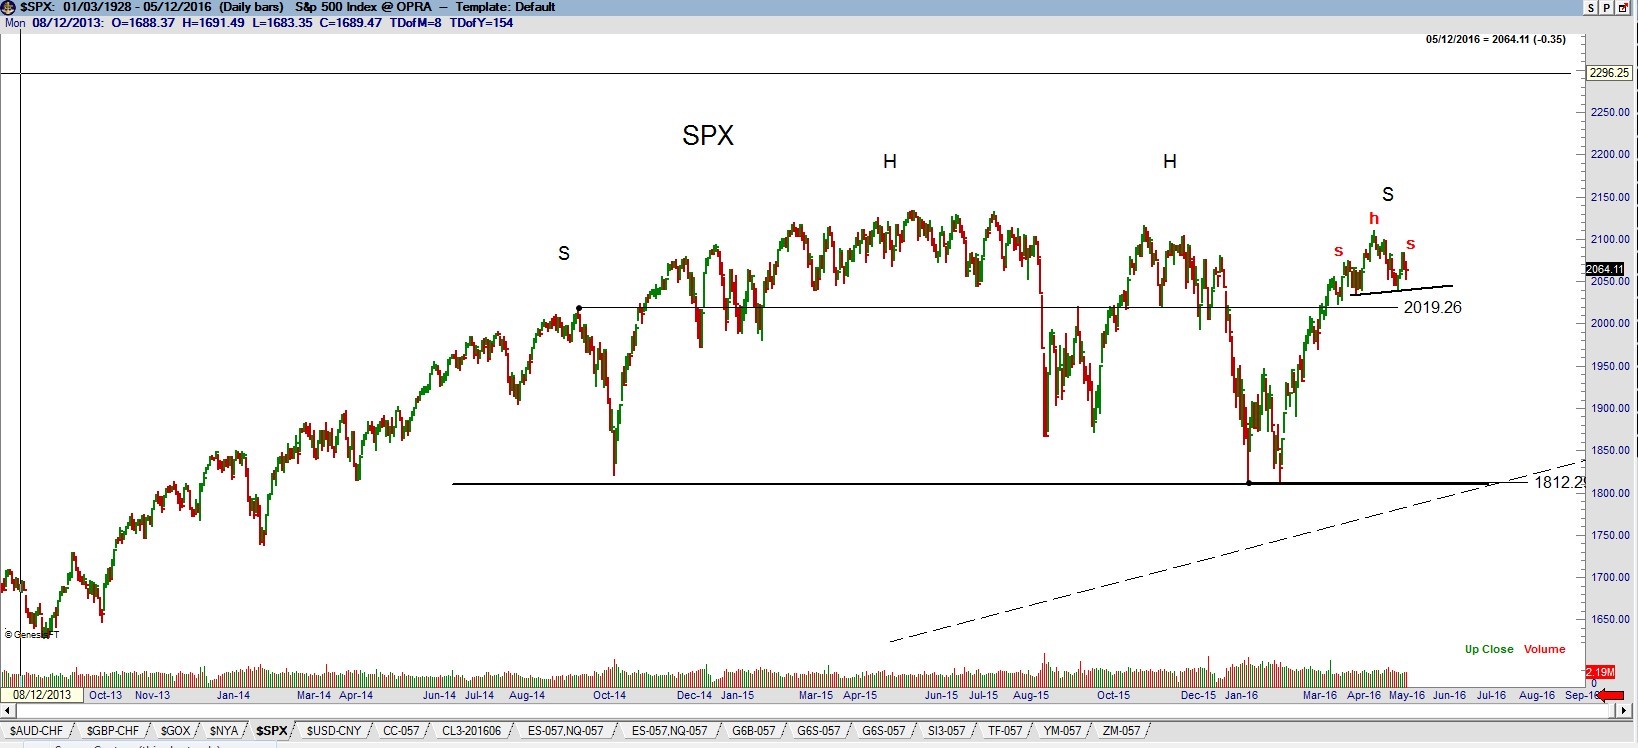
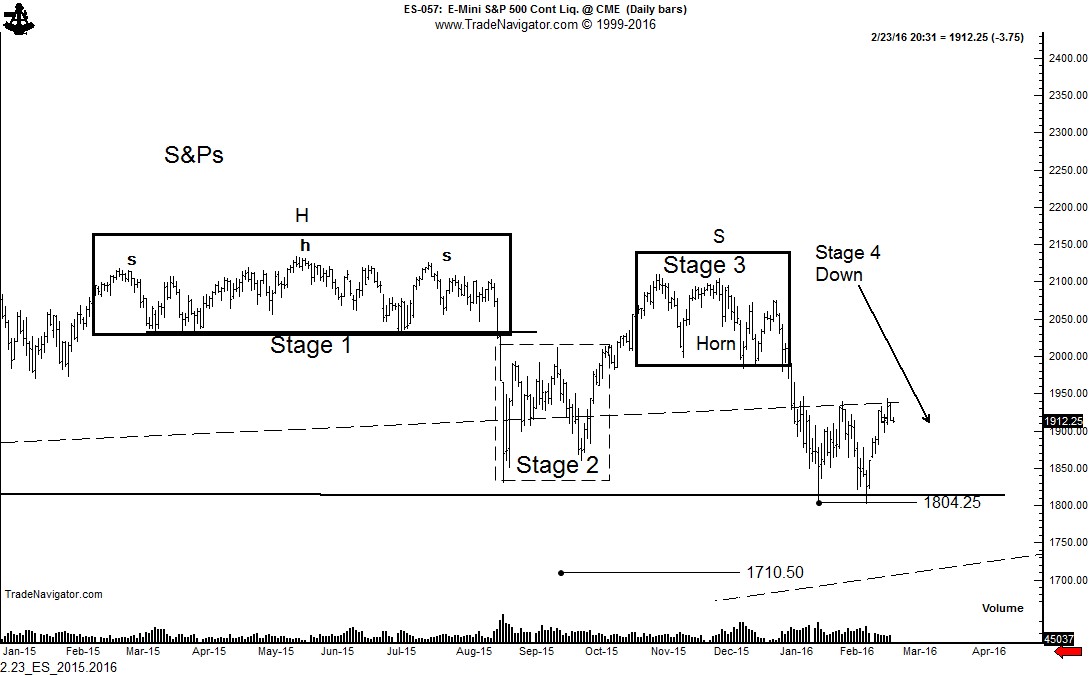
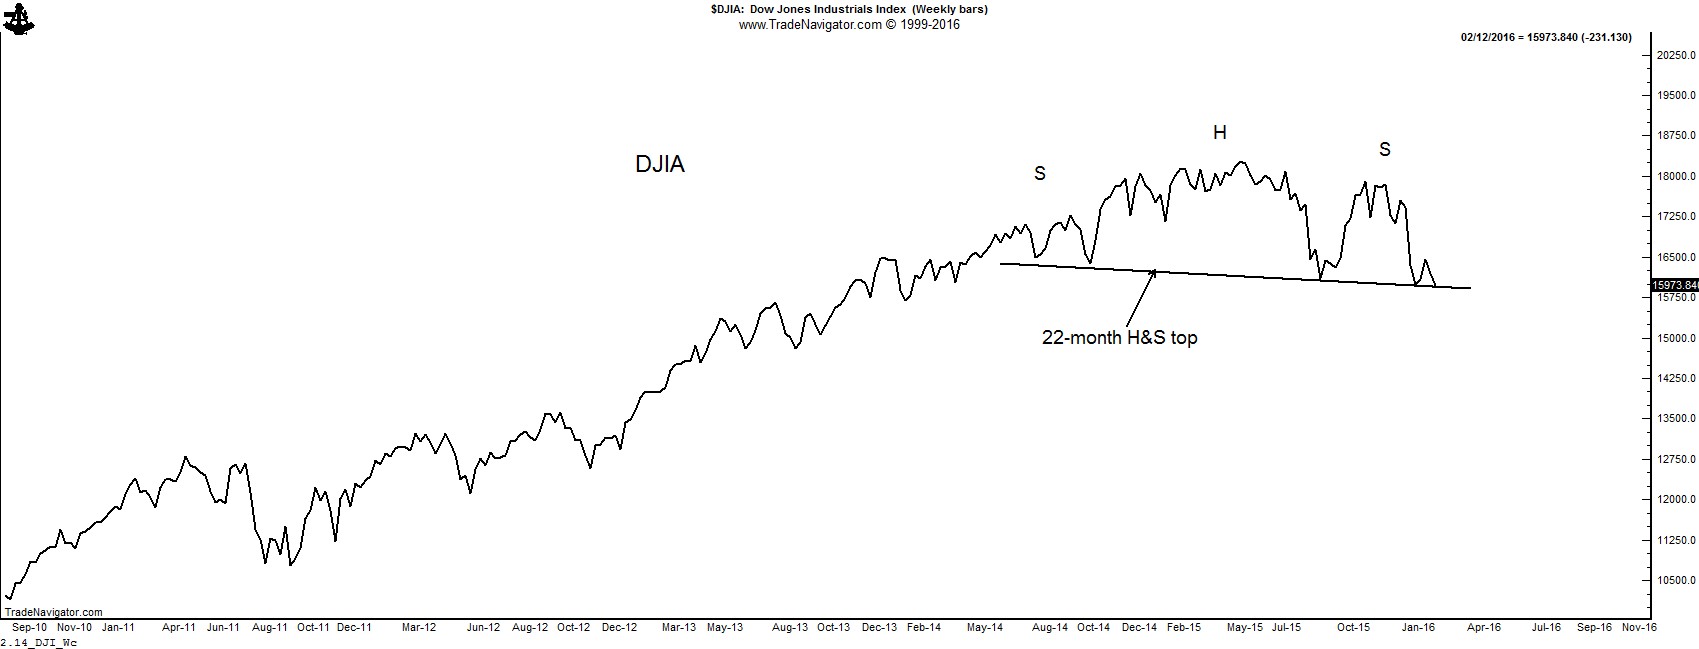
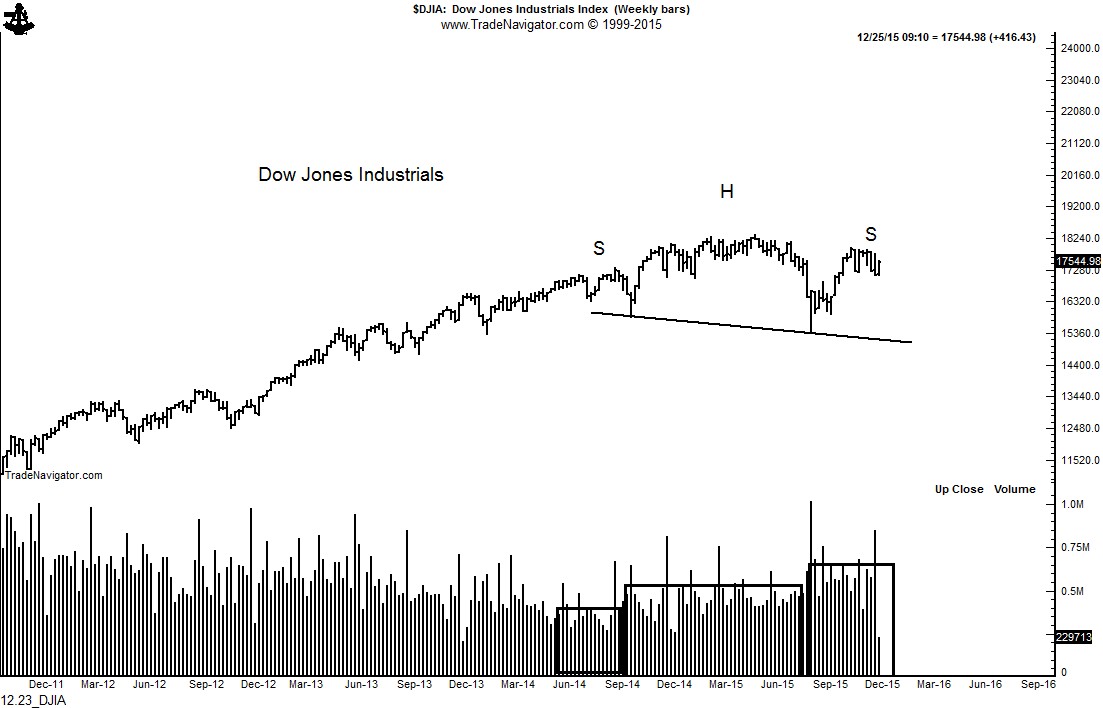
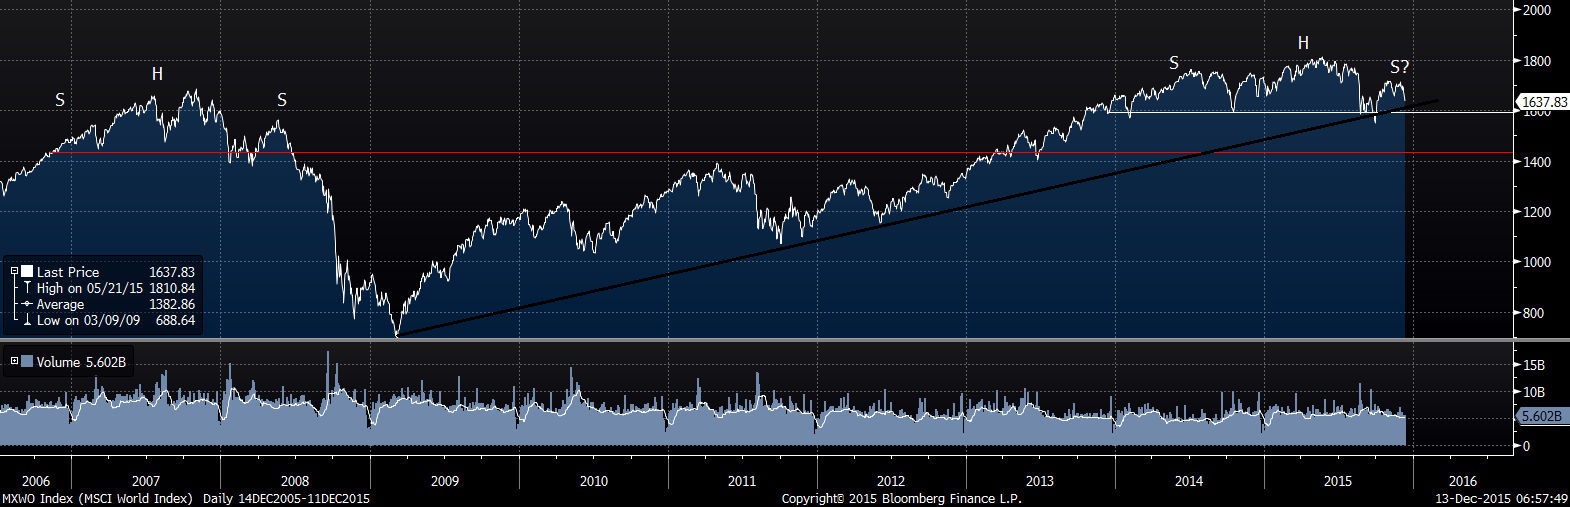
It is with some discomfort that I am always pointing out potential tops in the U.S. stock market indexes. But, I must call them as I read them. The S&P daily chart has made ZERO upward progress in 18 months. A possible complex H&S top formation is under construction. Also note the appearance of a 7-week H&S top pattern. I am willing to short this smaller H&S pattern if given a well-defined risk point. I will give up on a bearish interpretation of the S&Ps if a new high is made – but this does not mean I would have any interest in being long in new high territory.

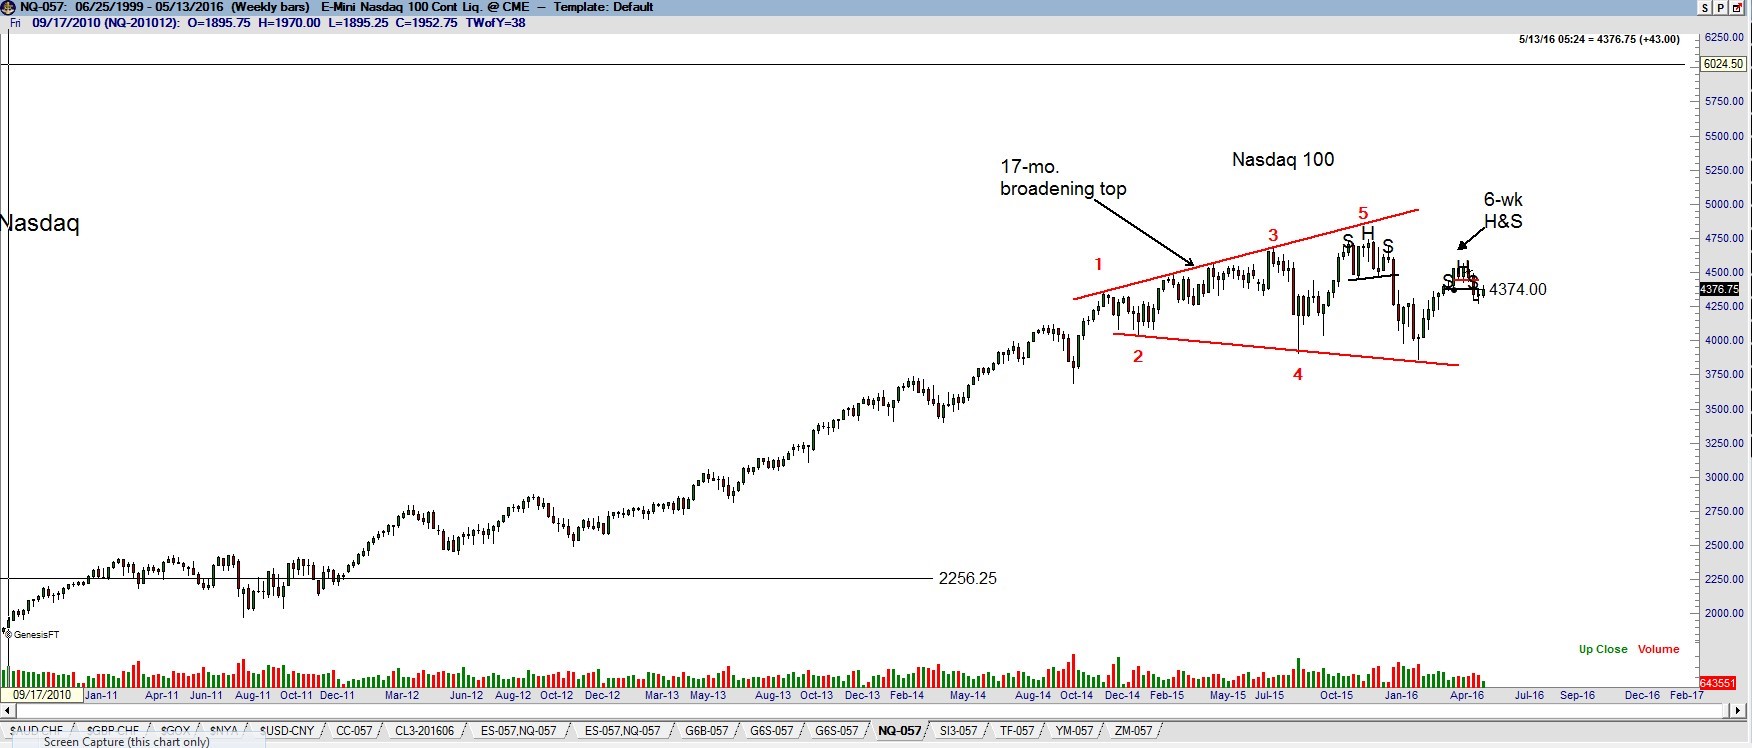
The Nasdaq is tracing out a possible broadening top, although as I have pointed out in recent updates, the rally from the Feb 2016 low has exceeded the normal construction of a true broadening top. Outside of the Nifty (India), the Dow Utilities (dividend play) and the Japan Mothers Index, I have a hard time finding a futures market index I am willing to own.


S&P 500 completed head and shoulders top - Stock market updates - Factor Trrading - Peter Brandt


Nasdaq is tracing out a possible broadening top - Stock market updates - Factor Trrading - Peter Brandt

plb

##

Is the present decline in the S&Ps a déjà vu of 2011?


Examining the chart structures of 2011/2012 with the present period

Classical charting principles at the core represent analog analyses -- that certain price patterns tend to repeat over time with slightly different variations.

An interesting analog situation has developed in the S&Ps. Some technical analysts have declared that the current market construction is analogous to 2011/2012 and will be similarly resolved by a continuation of the dominant bull trend. I completely disagree. Let’s examine the construction components of each period. The top chart is the S&Ps during the 2011/2112 period. The bottom chart is the current market.
  • Both periods had a textbook H&S top and, coincidentally, each top was completed in the month of August -- both marked as Stage 1
  • Both periods quickly met the target of their respective H&S top patterns only to develop a period of extreme volatility -- both marked as Stage 2
  • Both periods then rallied sharply back into the price zone of the initial H&S top pattern only to develop an other range of volatility -- both marked as Stage 3
2.23_ES_2011.2012 2.23_ES_2015.2016 Read More

The chart case for a bear market in U.S. equities


All major U.S. stock indexes are forming potential tops

A case can be made based on classical charting principles that the current decline in the U.S. equity markets is just phase one of a larger price decline -- in other words, that U.S. stocks are in a bear market. Consider the following. Factor believes that the most significant price of the day is the closing price and the most signficant price of the week is Friday's closing price. The weekly closing price chart of the DJIA displays a possible H&S top pattern. This top has not yet been completed, but a Friday close below 15,800 would do so. 2.14_DJI_Wc Read More

The U.S. stock indexes are NOT making H&S tops!!!

Xmas tree H&S  

Note: The post herein was absolutely wrong on the analysis of the H&S top in stock indexes. Guess what -- traders are wrong from time to time. I make bold calls and some are right and some are wrong. At the end of the day, price is king and nothing else matters. Members of the Factor research service know that I over-rode the analysis herein on January 6, cautioning that the stock market had deep internal trouble.

Classical charting principles have rules. The Head and Shoulders is a classical chart configuration. The apparent and well-advertised H&S top in the U.S. stock indexes do not meet the rules.

Perma-bears, a H&S top is not sitting for you under the Xmas tree!

Sorry to all of you stock market doomsayers, but labeling the U.S. stock index charts as H&S tops just does not work. Volume is an important criteria upon which to judge the validity of the H&S patterns. Richard W. Schabacker (Technical Analysis and Stock Market Profits), and later, John Magee and Robert Edwards (Technical Analysis of Stock Market Trends), are considered the pioneers in classical charting principles. According to the founders of classical charting, as a rule volume should be greatest in the left shoulder or head and lightest in the right shoulder in order to validate a H&S pattern. As the charts of the Dow Jones Composite, Dow Industrials and S&P 500 show below, the largest slug of volume has been in the right shoulder. This is NOT a sign of a valid H&S pattern, thus the interpretation of a H&S top in the U.S. stock index charts is not likely to be correct. 12.23_DJIA Read More

The Chart of the Month — MSCI World Index building a top??


MSCI World Index forming a massive 2-year H&S top

The MSCI Index appears to be rolling over in a right shoulder of a significant top pattern. One must be blind not to notice the similarities between this potential top and the chart top completed in 2008. Also, notice how the right shoulder held at the 6+ year trendline. The completion of the H&S top would also violate the trendline. A completion of this top could lead to a decline toward 1400. MSCI   
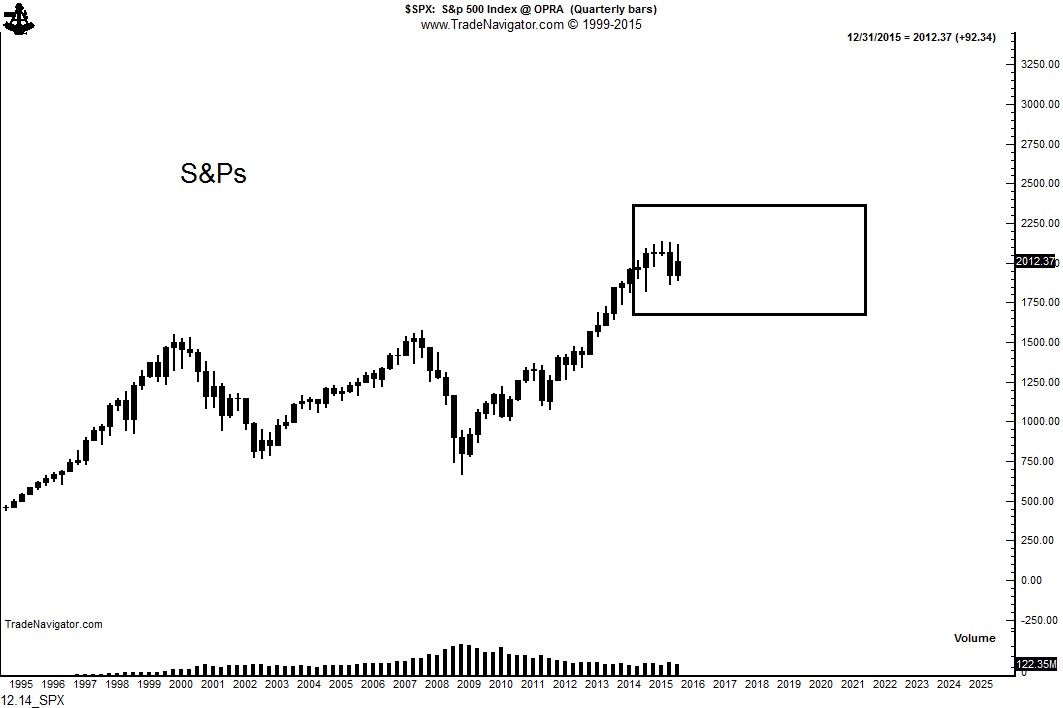
But I am NOT a doomsayer. In U.S. stocks I am NOT a bear and I am NOT a bull. In fact, I believe the S&Ps will remain in a range of 10% above the recent high to 10% below the recent low for the next five to eight years. 12.14_SPX Read More

S&Ps — a breakaway down gap is very possible

This content is for members only

Some shorter-term charts that are ready to move

This content is for members only

Chart patterns I am watching this week

This content is for members only

A lesson in charting — great trendlines often begin at a price gap

This content is for members only

If you want to be short U.S. stock indexes, do it with your enemy’s money

This content is for members only