Tag Archive for: NQ_F

The chart case for a bear market in U.S. equities


All major U.S. stock indexes are forming potential tops

A case can be made based on classical charting principles that the current decline in the U.S. equity markets is just phase one of a larger price decline — in other words, that U.S. stocks are in a bear market. Consider the following.

Factor believes that the most significant price of the day is the closing price and the most signficant price of the week is Friday’s closing price. The weekly closing price chart of the DJIA displays a possible H&S top pattern. This top has not yet been completed, but a Friday close below 15,800 would do so.

2.14_DJI_Wc

Read more

Some shorter-term charts that are ready to move

Nasdaq ($NQ_F, $QQQ), S&Ps ($SPX, $ES_F), Apple ($APPL), NYSE Composite Index ($NYA) and Nike ($NKE) appear ready for a strong advances

Hey all you stock market bears, get prepared to fade these breakouts!


4.23_AAPL 4.23_ES_D 4.23_NKE 4.23_NYA 4.23_QQQ

Analyses of these charts — and many others — are routinely provided to members of the Factor Email Service (see upper menu bar)


###


Many great looking charts


Presented without comment — since so many of you skeptics do not believe in the value of charting.

When us chartists get it wrong (and we do) you claim charting does not work. When you macro econo fundo guys get it wrong, you call it a “revised forecast.” What a joke!


4.10_6GN_W 4.10_GEZ7_D 4.10_NDK_D 4.10_NQ57_D 4.10_PAM_D 4.10_SBK_D


Do you want to see how these charts end up playing out. click “Subscription Membership” here or at the top navigation bar. Membership only open to open-minded traders. Critics of charting are open minded in a way — they have a big hole in their heads.

$NKD_F, $NQ_F, $PA_F, $NZDUSD, $GBPUSD, $SB_F, $GE_F

###


The technical case for another advance in the Nasdaq index


A good trading rule is to be long the strongest when long and short the weakest when short.

The Nasdaq is the strongest U.S. stock market index.

The correction in from the August highs in the S&Ps and Dow have many market technicians shouting “major top!” Of course, these perma-bears will eventually get it right. But, in my opinion, the Nasdaq is telling a different story.

The advance in 2011 completed a major 11-year base in the Nasdaq 100 with a target of 3476 (see monthly graph below).

 9.5_NDX_monthly

Despite the weakness in the Dow especially, the recent decline has been quite mild. In fact, the Nasdaq is within striking distance of making a new 13-year high — I believe there is a story to be told with this fact. Healthy bull markets continue to make new highs. And making new highs continually is a sign of a bull market. A close above 3150 by the nearby Nasdaq futures contract would indicate another advancing phase.

 9.5_NQ_daily


$NQ_F, $QQQ, $NDX


It’s déjà vu all over again — S&Ps gap higher on New Year’s Day for second straight year

The New Year’s Day breakaway gap — if not filled — could lead to an entire year of upside gain

In 2012, New Year”s Day fell on Sunday. The markets were offically closed on Monday, and opened the New Year on Tuesday, January 3.

However, the electronic markets traded on both January 1 and 2, 2012 — gapping substantially higher right from the start on Sunday afternoon’s open. So when traders returned on Tuesday the U.S. stock indexes are sharply above the December 20, 2011 closing levels. While the S&Ps came back down and barely closed the gap on January 5, the Nasdaq never closed its gap and trended higher the rest of the year.

1.2_ES57

1.2_NQ57

In other words, the New Year’s Gap (2012) was a daily and weekly gap and go.

It is now déjà vu all over again. The S&Ps gapped higher on Monday, January 1, 2013. This gap, if not filled, will be yet another daily and weekly New Year’s Day Gap and Go. Note that the S&Ps could completed a 13-week symmetrical triangle in the process.

1.2_ES57_2013

Markets: $SPY, $ES_F, $SPX, $QQQ, $NQ_F

###


Nasdaq set up for a major buy signal

Nasdaq chart can be interpreted as extremely constructive

 This post presents a POSSIBILITY, NOT A PROBABILITY OR CERTAINTY

 I have written extensively how chart tend to morph over time, one possible pattern morphing into the next and the next and the next, until at last a market is ready to declare itself. Even when a trader thinks a chart is ready to declare itself, further (sometimes extensive) morphing may follow.

 Well, the Nasdaq chart is at a point of possible declaration. Presently the analysis below is my preferred interpretation – until future morphing makes me change my mind.

 Consider the following analysis:

On the monthly graph, the rally in January 2012 confirmed a possible 10-year double or failure bottom. The target of this pattern is 3450.


 The weekly chart can be viewed as follows:


  • The rally in late January completed an 11-month complex continuation H&S on the weekly graph.
  • The initial target of 2750 from the H&S was met in late March.
  • The recent decline retested the neckline of the weekly H&S pattern.

On the daily graph, the retest of the weekly H&S pattern has taken the form of a 5-week inverted H&S configuration. The neckline of this pattern is upslanted on the high/low chart (thick line) and slightly down-sloping on the closing price graph (thin line). I prefer to use the high/low chart. A decisive close above the neckline will complete the pattern and signal a buy signal.


I want to repeat – this is a presentation of a possible interpretation. In fact, if the market rolls over and closes below the right shoulder low of 2505 a sell signal would be flashed. Also, if the daily chart H&S has an upside breakout that does not follow through it would represent a failure sell signal. Charts morph – sorry, but this is the way charts work.

Markets: $NDX, $NQ_F, $QQQQ, $QQQ


###

Analog indicates higher Nasdaq prices


The 2010-2011 rally in the stock market is the analog for the current advance.

I have previously posted the reasons why I believe the current rally in the Nasdaq is an analog to the rally in late 2010 into 2011. If this analog continues to unfold, the present pause in the advance should be mild and brief, followed by another 10% advance in price.

The charts below compare the present rally in the Nasdaq to its analog in 2010-2011.

The type of sustained steady rally we have experienced from the December low seldom terminates with a top. This steady unrelenting rally is an indication of a dominant trend that will continue. Breaks are a buying opportunity.

Markets: $QQQ, $NQ_F


.

A more in depth look at the stock indexes — how bullish is bullish?


Stock indexes are potentially near-term, intermediate-term and long-term bullish, but some technical hurdles remain. 

If you do not see the PDF below, click here.

[scribd id=78750736 key=key-2f4byc69psskbmmukv50 mode=list]

Markets: $QQQ $NQ_F $ES_F $SPY


.

Lessons from seven weeks of stock market chop

For those of you who wish to gain knowledge in classical charting principles, the choppiness of the past seven weeks in the U.S.stock market indexes offers some excellent lessons.

 Let me meander through these lessons, not necessarily in a sequential order.

First, this choppiness has likely to have been financially punishing for those who missed the initial major thrust from late July through August 9. Why? Because the natural inclination of human emotions is to trade yesterday’s market. Feeling as though one had missed out on such a massive move, a trader would press the issue expecting the market to offer a second chance.

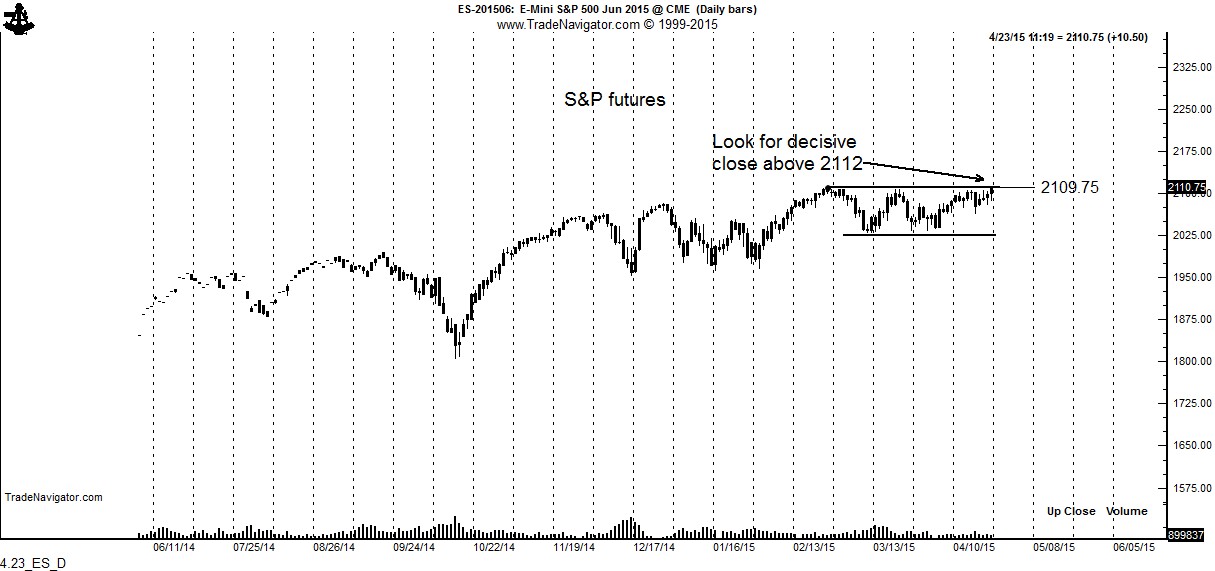
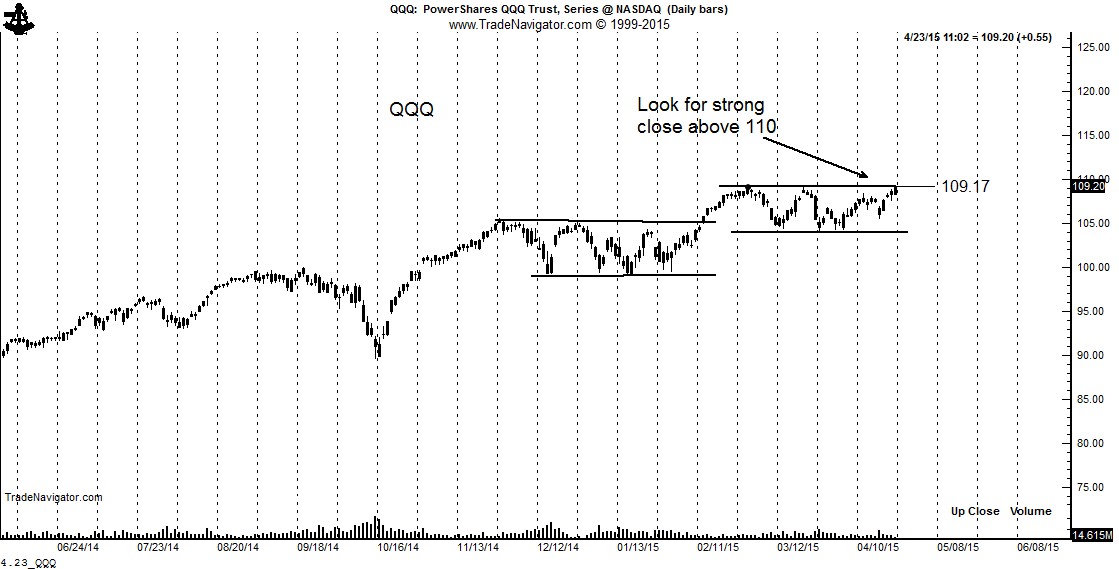
Second, corrections can become complex. Charts that enter trading ranges tend to morph from one pattern to a larger pattern. What looked like a small retest wedge in the Nasdaq 100 on August 17 turned into a flag by early September. A completed flag in the S&Ps on September 12 quickly failed and reversed. A possible continuation H&S completed by the Dow on September 12 also failed to materialize. A possible intraday secondary completion of a bear channel in the Nasdaq on Thursday quickly reversed. Morphing is the norm for range bound markets.

It is important to add, relative to point number two above, that at no time was the range resolved. There were many smaller possible patterns within the range, but the range was never violated. Playing smaller patterns within larger patterns (often with hourly charts) is dangerous territory.

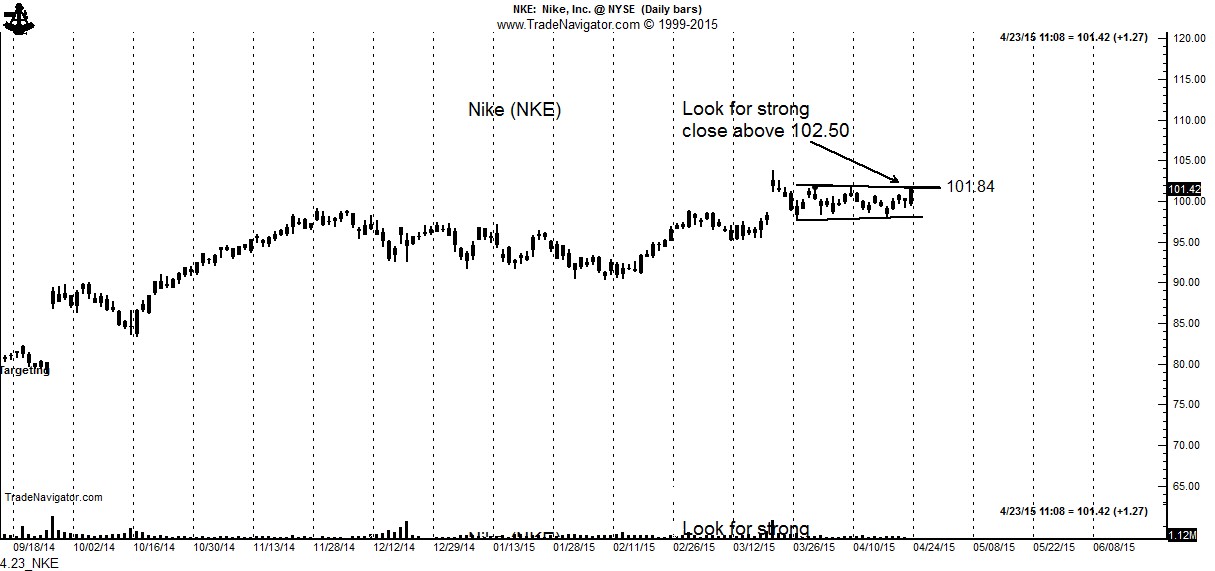
Third, and some of you might have burned on this one, selling a period of weakness or buying a few days of strength within a range-bound market is a losing bet. If you write one new rule onto your ever lengthening rules list, make it this one. Reversion to the mean is the norm for ranges. Within ranges, if you have to trade (which you should not have to do), sell at the upper end and buy at the lower end until the range has been resolved.

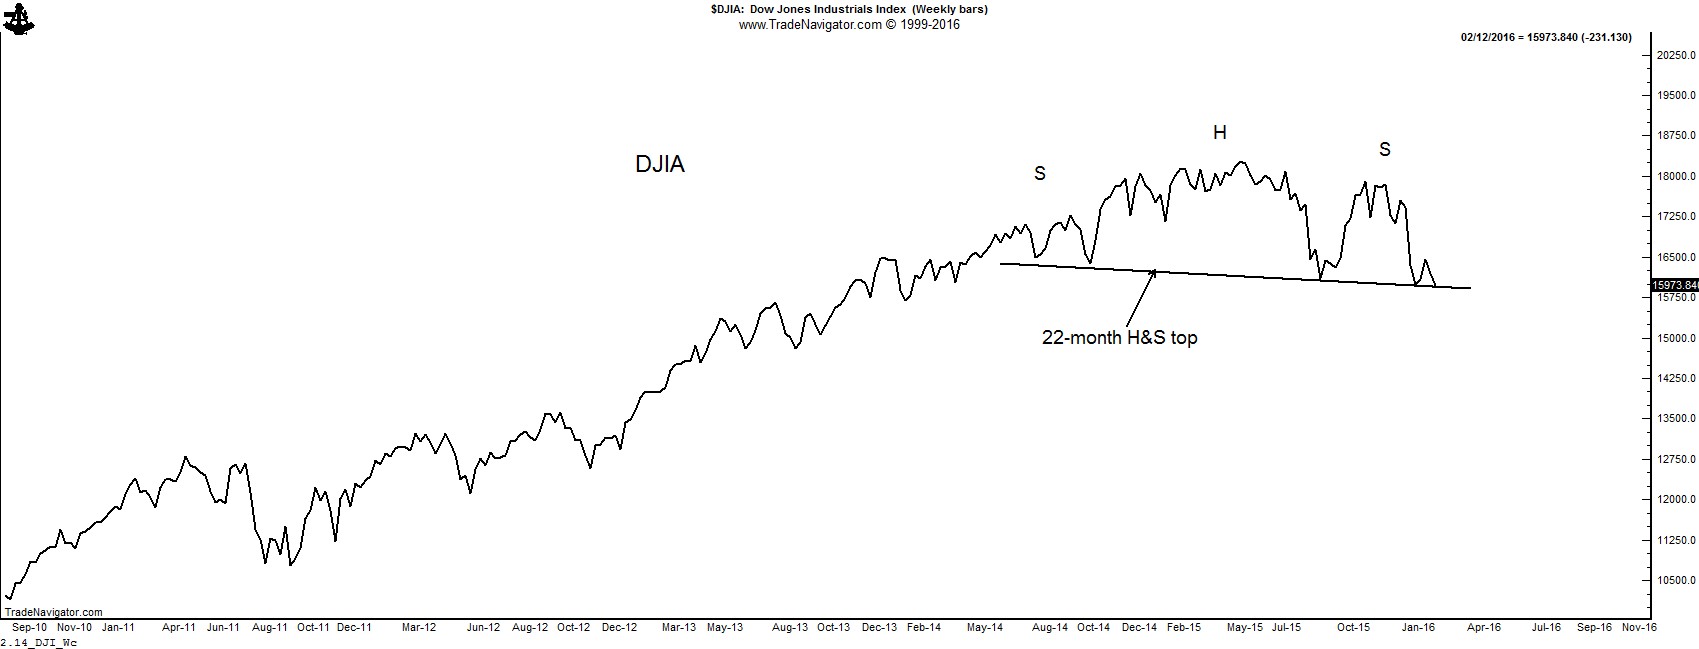
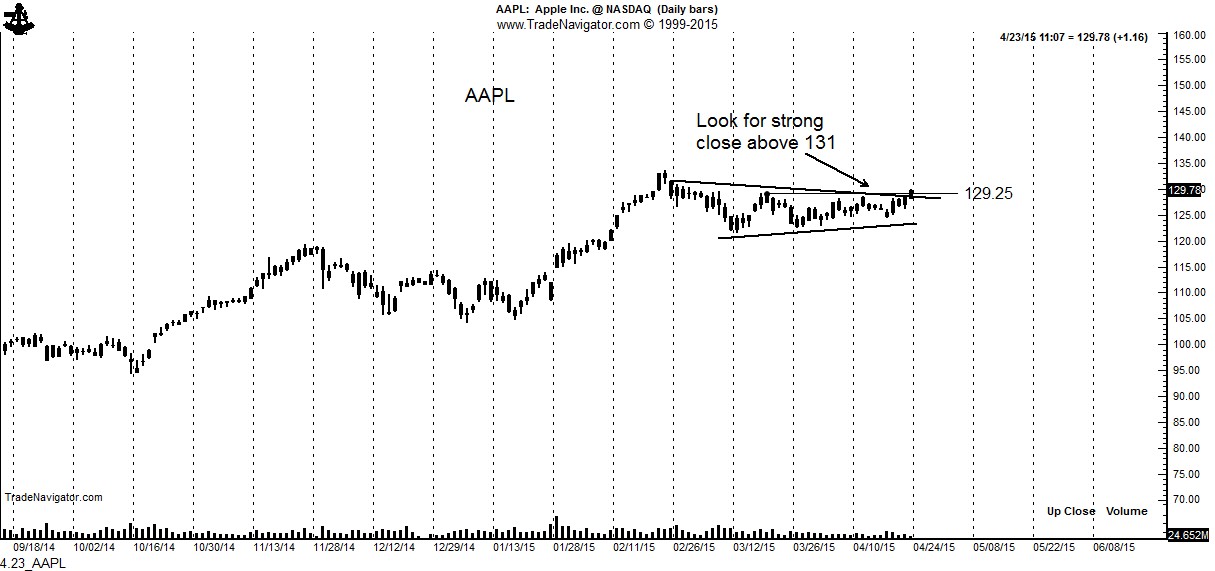
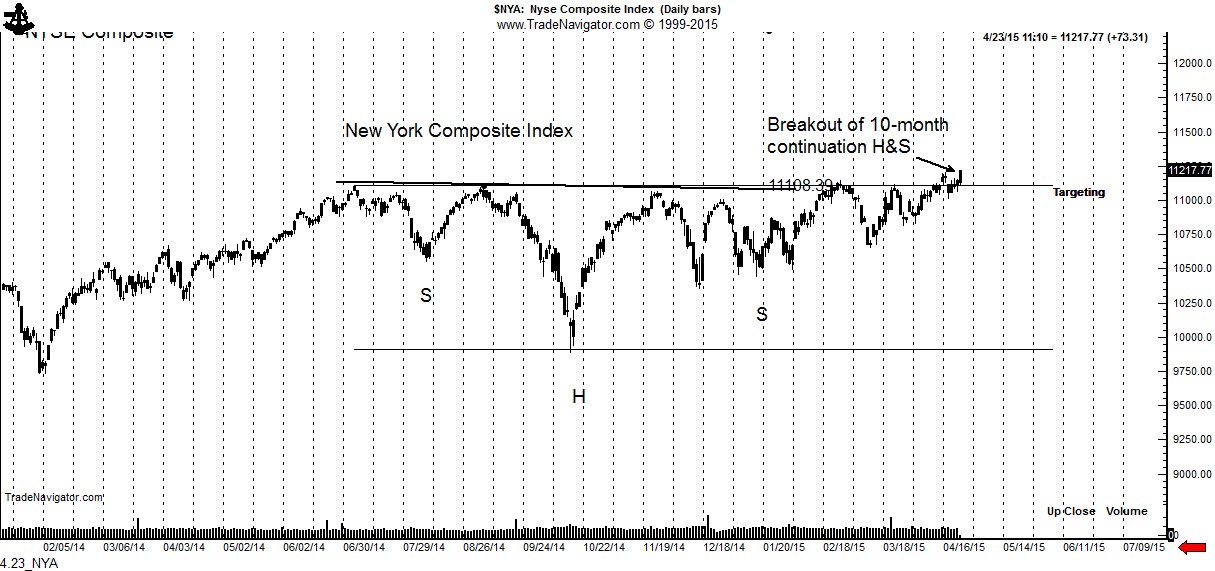
Fourth, the wedge in the Nasdaq, the flag in the S&Ps, the pennant in the S&Ps and the channel in the Nasdaq were all “diagonal patterns.” Readers of my book will understand this concept. I generally hate diagonal patterns, defined by boundary lines that slant. Diagonal patterns are the worst characters for morphing. Horizontal boundary lines that account for all of the lows within a congestion (the continuation H&S in the Dow did not do this) are what you want to look for.

Fifth, there are several MAJOR dangers to trading within a range-bound market.

  • Getting chopped up within the morph can make you gun shy when the real breakout occurs.
  • Range bound markets tend to force a chartist into violating his or her trading rules.
  • A compulsion for being pre-positioned for the “next” big breakout can result in a trading becoming obsessed with a market. This is never good. You should never feel as though you have to have a position or you will somehow miss a move.
  • Being obsessed with a particular market can cause you to miss good opportunities in other markets.
  • Being obsessed with a particular market can force you start monitor-watching. Monitor-watching will play on your emotions and force you out of good decision making skills.

Sixth, markets go when they are ready to go, not a second sooner. The stock market will resolve itself at some point.  I really thought yesterday was going to be a resolving day. It was not. So be it. There was a day in the futures markets when a strong move intraday had follow through. This was when there were pit exchanges and pit brokers and before the day of mean reversion HFT trading operations. Intraday thrusts can no longer be trusted within a trading range.

In the meanwhile predetermine a day in advance what your game play will be. Using market orders or tight limit orders within a trading range is a good indicator you are making a bad judgment. Avoid selling weakness and buying strength within a range. Keep your powder dry. Be patient.

Markets: $SPY, $QQQ, $DIA, $ES_F, $DJ_F, $NQ_F

###

Three very sexy price charts


Can a high/low/close bar chart actually be described as “sexy?” Well, if it can, I have three markets that meet the definition.


Copper ($HG_F)

I am sorry, but I got caught sleeping at the switch. I am not in this market. This is what happens when I do not have an order in place. A major top has been completed on the weekly chart as shown below. There is plenty of empty space below this market. This market should work its way toward the 2010 low at 275.

Notice on the daily chart that the top was completed with a breakaway gap. This is a very powerful signal.


Soybean Oil ($ZL_F)

The Bean Oil weekly weekly chart is possibly forming a classic descending triangle. This pattern is far from complete, but a chart to keep your eye on.


Nasdaq ($QQQ)

I continue to believe the stock market is experiencing a bear market rally. The strongest broad index has been the Nasdaq, primarily lead by Apple and few other choice names. The daily chart exhibits a possible rising wedge. Under this interpretation, the market put in a reversal day today, having tested the upper boundary of the wedge.

I would not be surprised to see some additional testing of upper resistance before the market finally rolls over. I did not do any shorting today. I remain short a one-third position in ES_F from early August. I want to extend my short position, but a one-day reversal is a sign of a pending top, not a top itself.

Markets: $QQQ, $NQ_F, HG_F, $ZL_F, $JJC