Tag Archive for: OIL

Have Gold and Crude Oil bottomed — What do the long-term charts have to say?


History repeats itself — although most often with slightly different twists


Price graphs have provided strong clues to the direction of Gold and Crude Oil in recent years. So the question is — what’s next?


Crude Oil summary

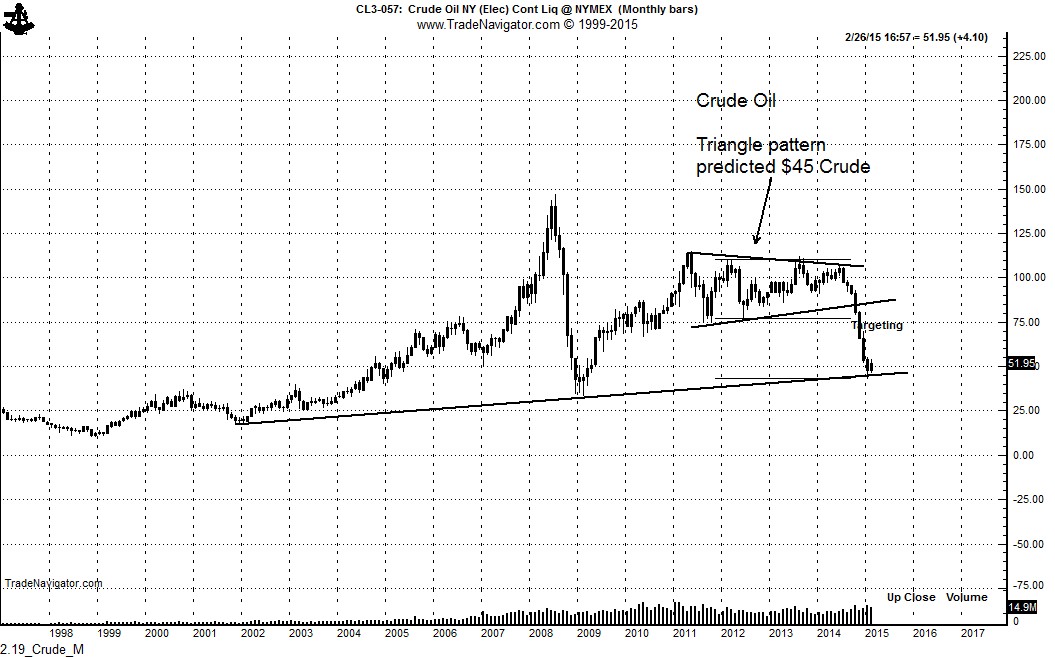
In August 2014 — with Crude Oil prices near $100 — this blog and the Factor email service began predicting a collapse in energy prices. This prediction was based on the formation of a symmetrical triangle pattern. We had been monitoring this triangle for more than a year.  Read our August 2014 analysis here.  The Factor initially projected a decline in Crude Oil to $65 — this target was then lowered to $45. Crude Oil producers scoffed at these forecasts. Crude Oil futures reached $44.20 on Jan 12, 2015.

2.19_Crude_M

The talking heads on CNBC and Bloomberg have now declared an end to the Crude Oil bear market. But, has Crude Oil bottomed? Should traders rush out and buy Crude Oil futures or related ETFs. I think not!

Let history be your guide.

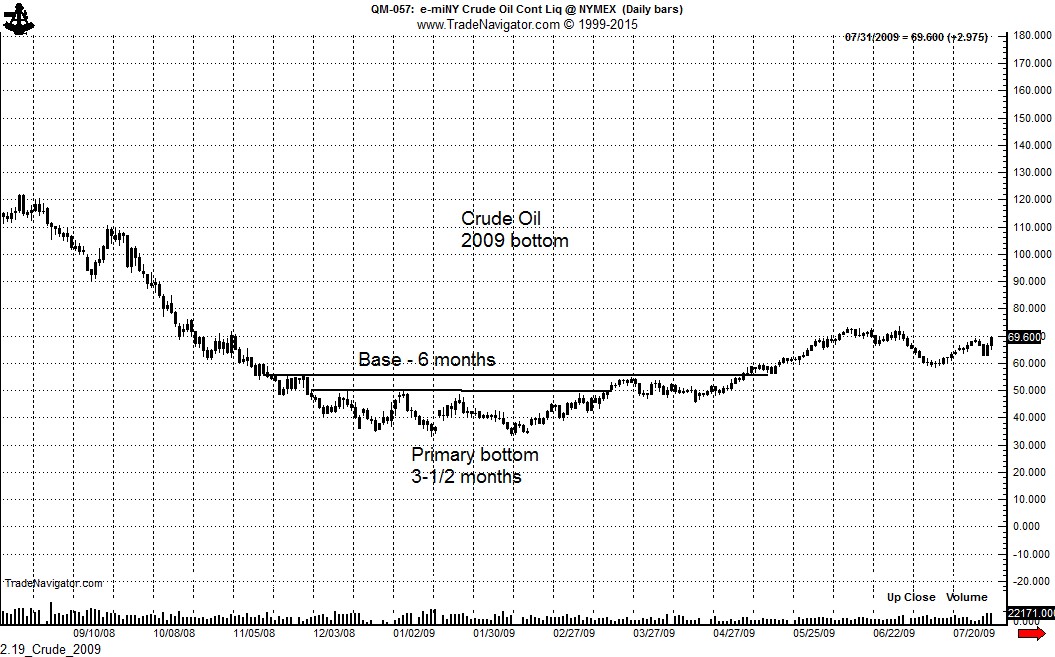
After the decline from $147 to $32.48 in 2008 (that’s right — a $114 decline), Crude Oil spent six months building a bottom on the nearby futures contract chart, as shown below. SIX MONTHS! The absolute low-to-date in this current Crude Oil bear trend occurred on Jan 29, only three weeks ago.

2.19_Crude_2009

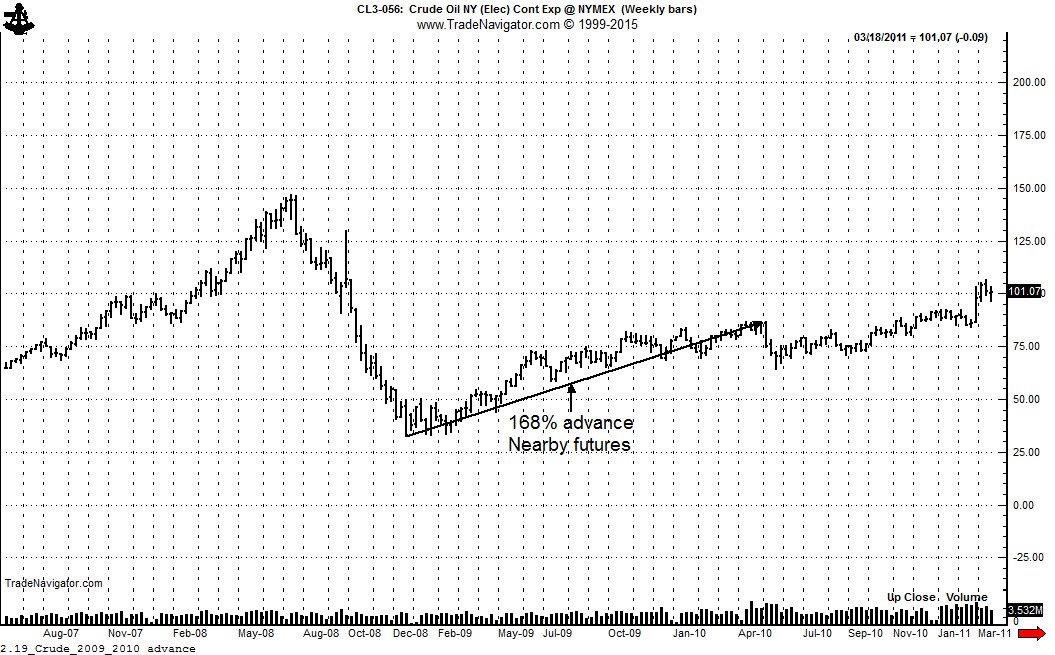
There is more to the story on why it is too early to become a Crude Oil bull. After the $114 decline in 2008, Crude Oil futures (nearby contract) advanced 168% from the Dec 19, 2008 low to the May 9, 2010 high, as shown below.

2.19_Crude_2009_2010 advance

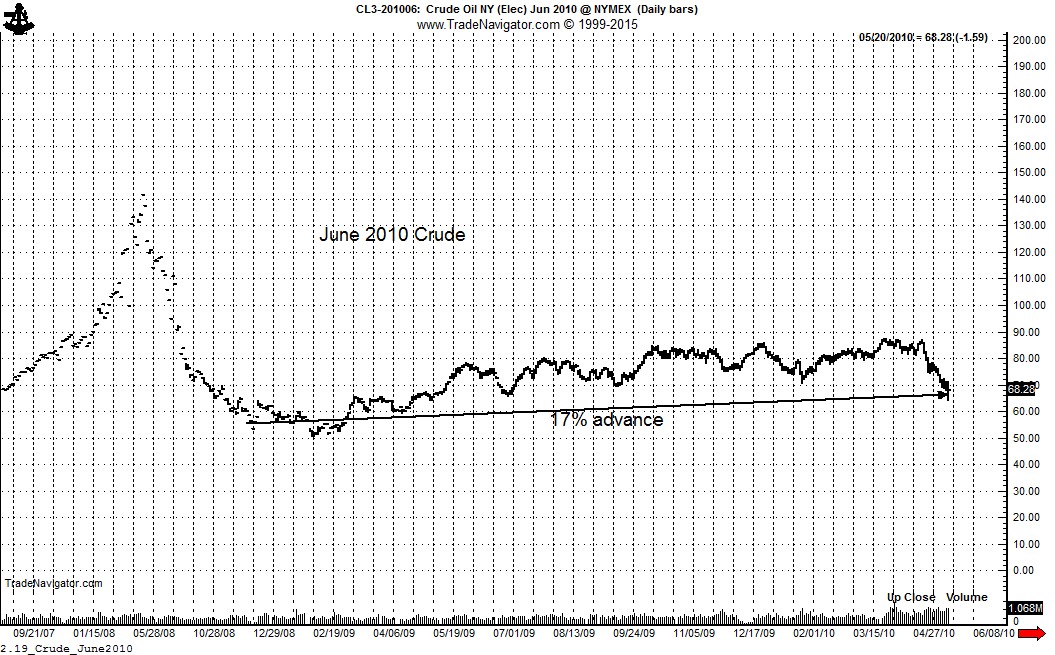
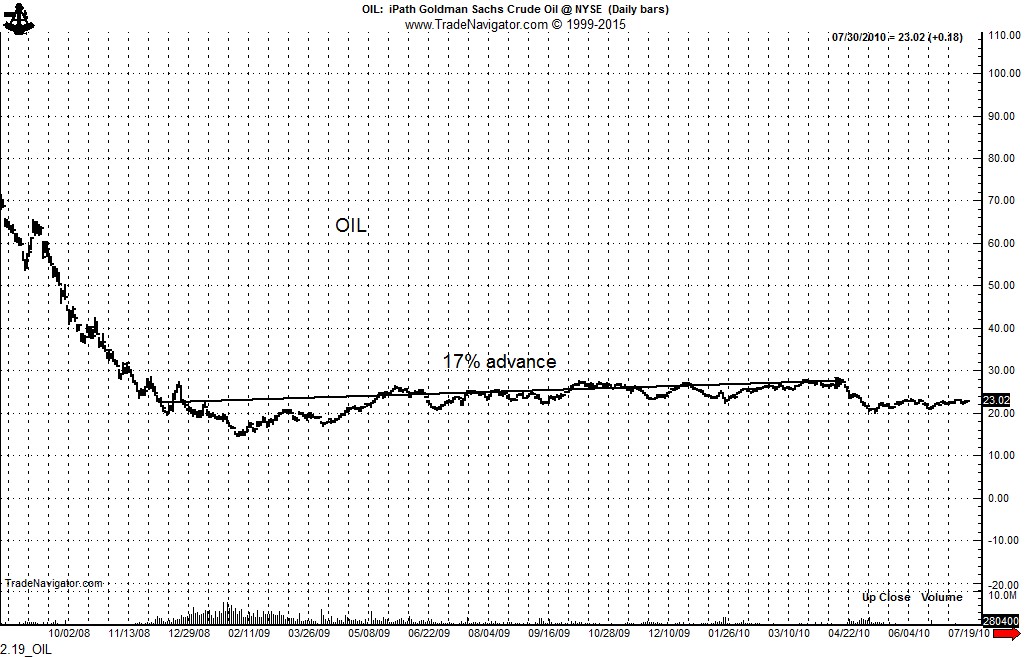
Yet, enormous carrying charges developed during the 2008 decline. From Dec 19, 2008 (low for nearby Crude futures) through May 2010, the June 2010 Crude Oil futures advanced only 17% as shown below.

2.19_Crude_June2010


Crude Oil ETFs did not do any better. If a trader bought the ETF OIL on Dec 19, 2008, the day Crude Oil bottomed, and exited at the April 2010 high, the gain was the same 17%. Not exactly a trade to write home about.

2.19_OIL


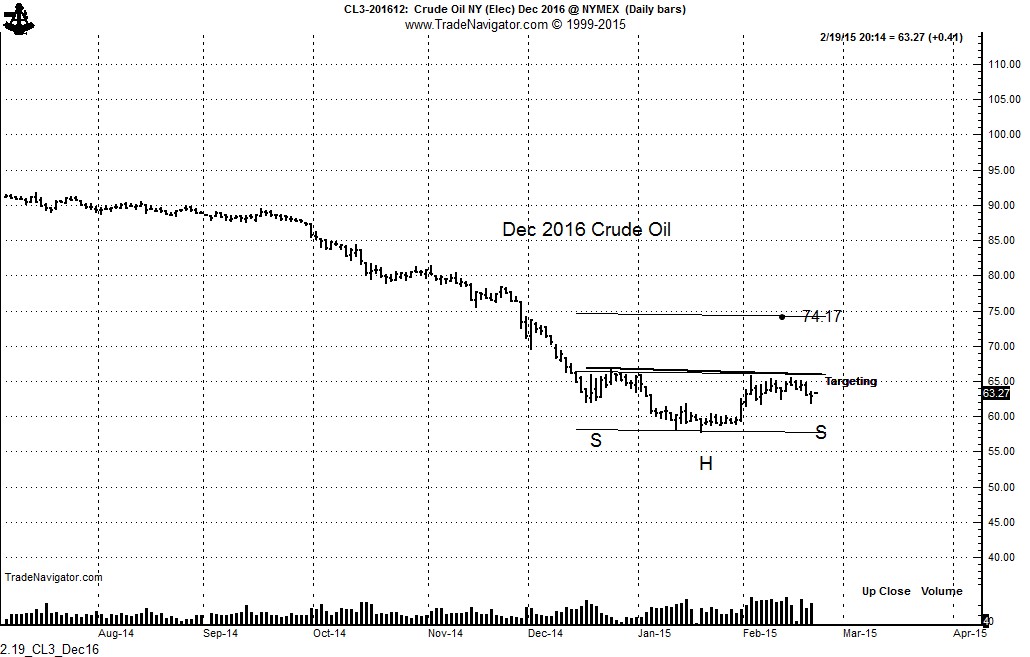
The current spread structure in Crude Oil futures has adopted the same profile as was the case at the 2008 low. The Dec 2016 futures closed today at 63.26, representing a 43% advance from the low made by the Feb 2015 contract. The frosting is off the cake. Worst case — Dec 2016 Crude Oil could decline to the mid $40’s as the market endures two to three years of depressed prices. Best shorter-term case — a rally by Dec 2016 Crude toward $70 could be a short sellers delight. Crude Oil prices fell a very long way in 2014, so a sharp snap-back rally is possible. As a classical chartist, I do note a possible H&S bottom in the Dec 2016 contract — so a rally toward $75 cannot be ruled out. But such a rally should be gobbled up by hedgers.

2.19_CL3_Dec16

Bottom line — spot Crude Oil may have bottomed, but making money on the long side will be for the quick and nimble. The deferred Crude Oil contracts have not yet seen their lows, although a dead-cat bounce could occur.


Gold summary

My perspective on Gold is unchanged. Gold is the ultimate charting market. The Gold market has always announced its intentions with the formation of a recognizable chart pattern. For background, please read the “Chart History of the Gold Market.”

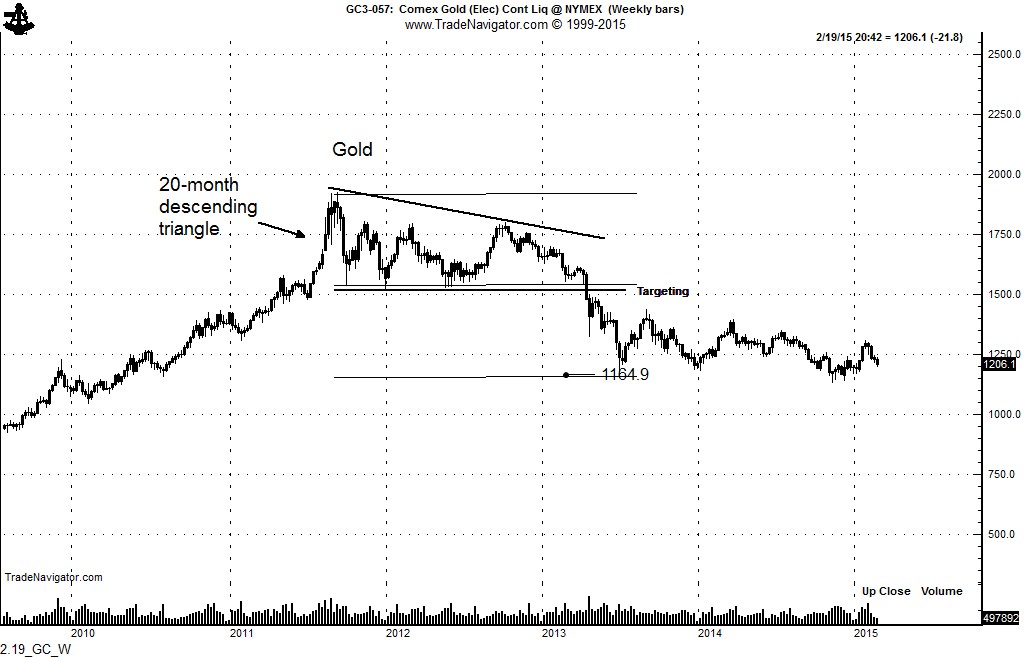
The last major pattern in Gold was the 20-month descending triangle top completed in Apr 2013. The target of 1165 from this pattern has been met.

2.19_GC_W


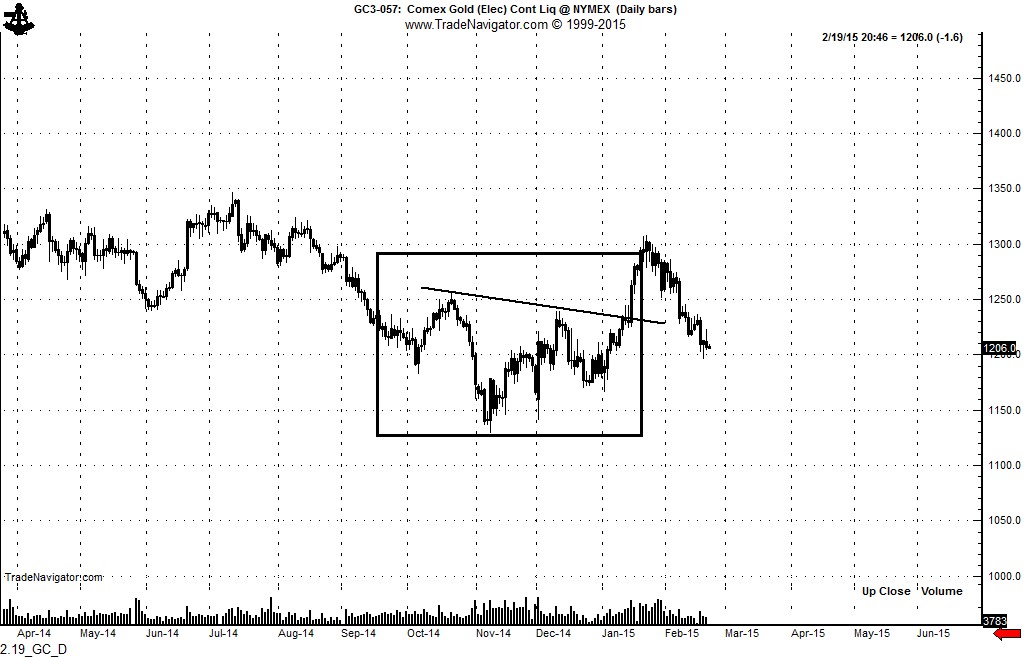
Yet, Gold has not developed a daily chart bottom — and I believe this is a necessary condition for any future bull market in the metal. I thought Gold had formed a H&S bottom in Jan 2015, but the recent decline has been too severe, so we are back to the drawing board. I see no trade in Gold at the present time.

2.19_GC_D


Markets: $OIL, $CL_F, $GC_F

Note: This post represents the type of technical analysis provided on a regular basis to members of the Factor service. Within the next few months the Factor service will impose a limit on the number of members — and an application process and waiting list will implemented. For more information on the Factor service, see the menu bar above.

###


Gap down in energy prices reminds me of my WORST trade ever


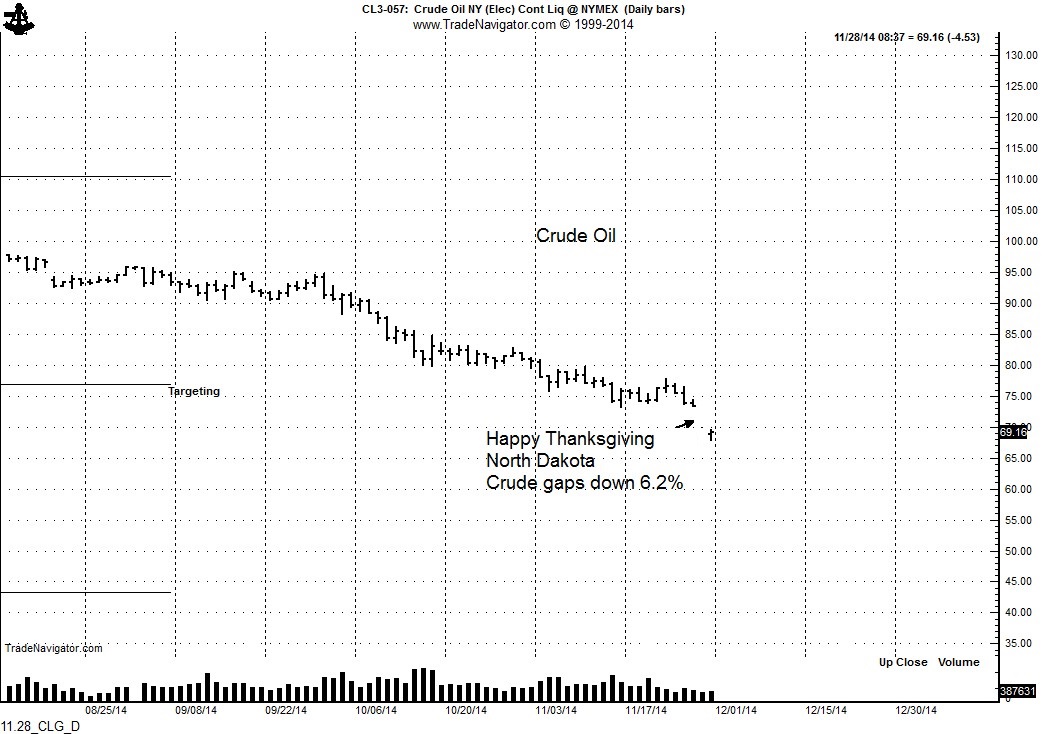
The 6.2% gap down decline from Wednesday to Friday is NOTHING compared to the beating I took in the Iraq War bombing down gap in 1991


The longs came back from their Thanksgiving Holiday with quite a surprise today, as Crude Oil opened on Friday 6.2% lower than Wednesday’s close.

11.28_CLG_D

As the saying goes … “You ain’t seen nothing.”

This price collapse reminds me of my absolute worst trade ever.

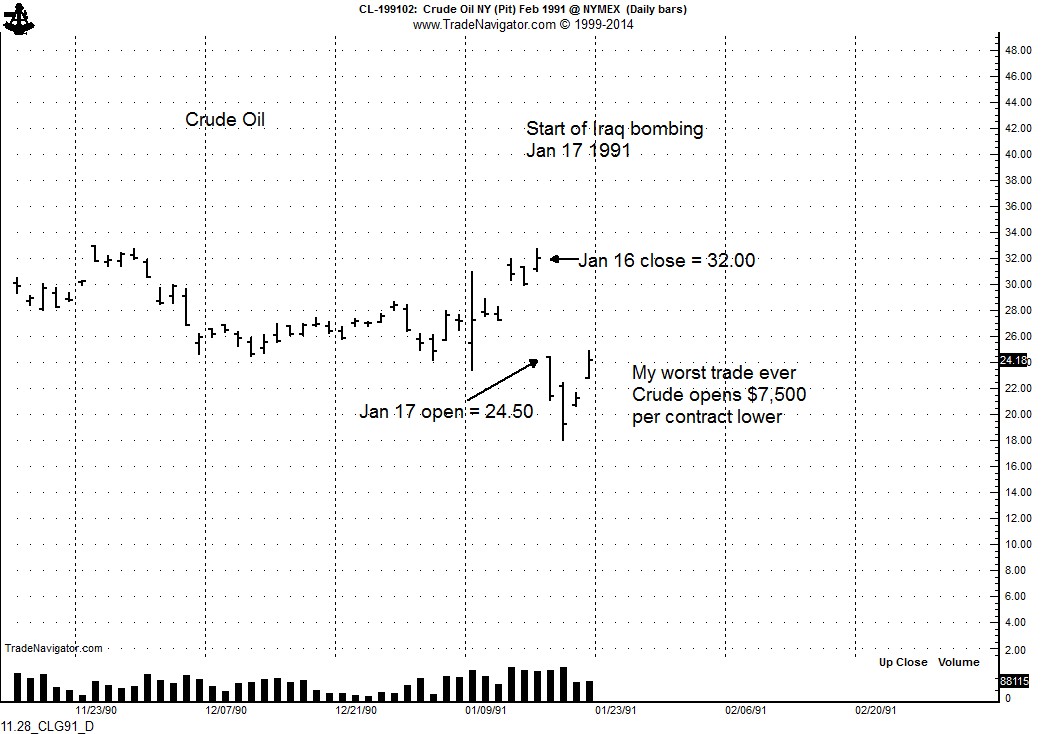
On 16 January 1991 I went home long Crude Oil. The price closed at $32.00. Remember, this is pre-24-hour trading. The U.S. started bombing Baghdad that evening — all of us “old guys” will never forget the footage from CNN.

I called London in the middle of the night — Crude Oil was trading up $2 on the Curb (us old guys will never forget Curb trading — it was an unofficial version of 24-hour trading). So I went back to bed and slept wonderfully well, fully expecting a big profit in the morning.

But, the morning came with a shock in what might be the most classic “buy the rumor, sell the fact” in history.

11.28_CLG91_D

Rather than opening higher, Crude Oil at the NY Merc opened a full $7.50 lower — or $7,500 per contract. That was a 23.5% decline from one trade to the next. Ouch!!!! This was my worst trade ever.

You “newbies” to trading worry about overnight gaps. You do not know what overnight gaps are.


$CL_F, $OIL

###
Why I am a $65 bear in Crude Oil


The charts could be an accident waiting to happen

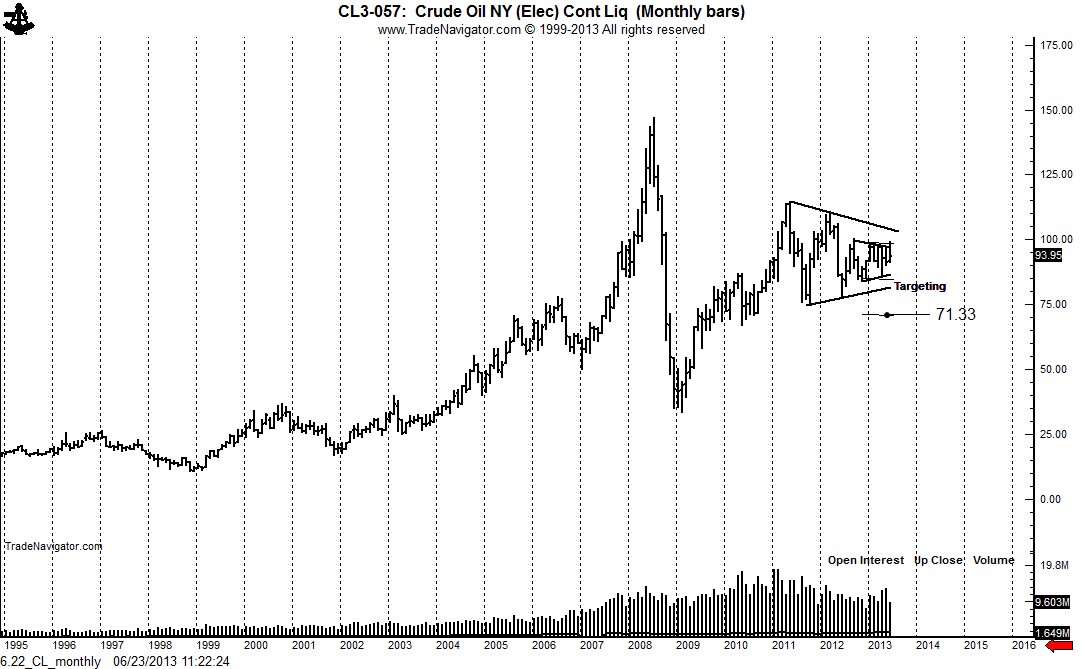
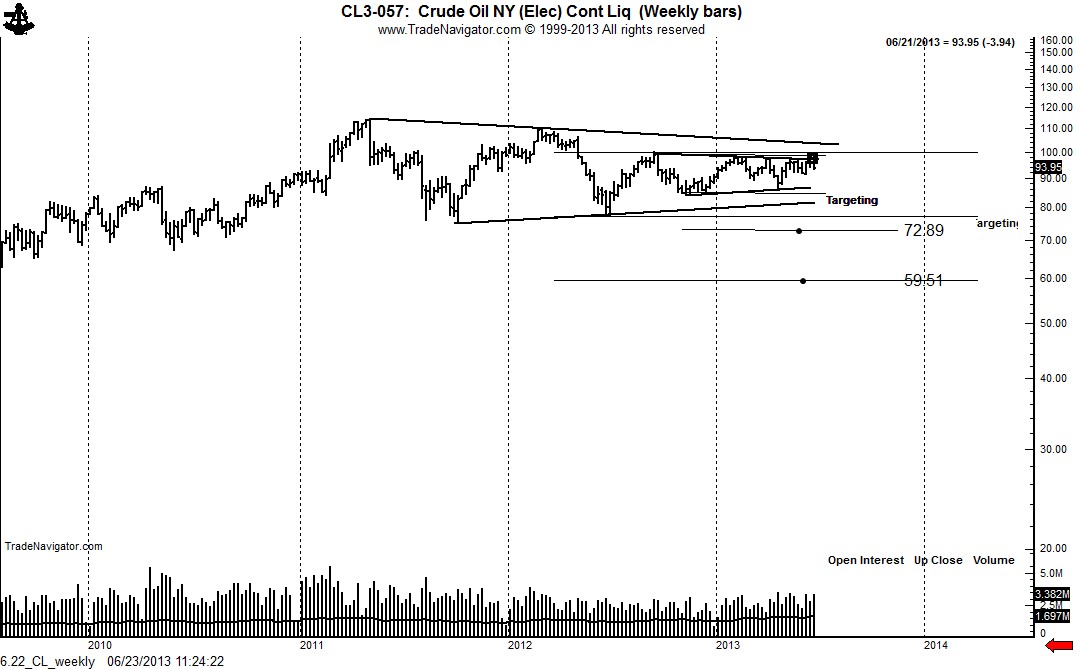
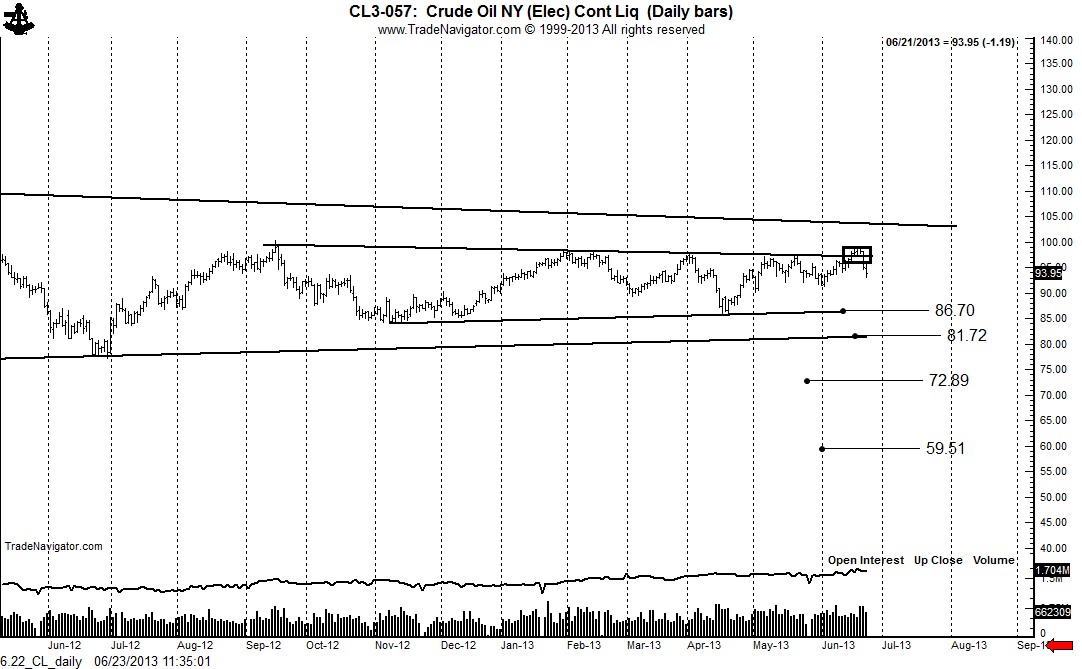
The monthly and weekly Crude Oil charts have been forming a 9-month triangle within a 3+ year triangle. This price behavior represents a tremendous amount of compression that will at some point be released.

Of great significance, in my opinion, was the upward price thrust in mid-June that completeed an inverted H&S and the smaller symmetrical triangle. This upward breakout has now proven to be a classic bull trap.

Targets are the lower boundary of the smaller triangle at 86.70, the lower boundary of the bigger triangle at 81.72, the target of the smaller triangle at 72.89 (assumed the completion of the smaller triangle) and the target of the larger triangle at 59.50 (let’s call it 65.00).

But, you might say, this kind of drop is impossible because producers must make money. Who says?? Markets in supply surplus (such as energy at the present time) tend to go the production price of the most efficient producers. Plus, which one of you macro economic fundamental experts predicted Crude could drop from $148 in mid 2008 to below $40 in just six months.  Don’t you all raise your hands at once! So take your pet macro economic/fundamental scenario and burn it with the trash!

6.22_CL_monthly

6.22_CL_weekly6.22_CL_daily

Disclaimers and caveats: I am short Crude Oil futures and will be stopped out if the market makes a new high. I am looking to add. Decisive closes below 85.90 and then below 77.25 are required to confirm a target of $65.


$CL_F, $USO


Hey Silver bulls, it’s time to cut the B.S. and start buying


Silver bulls are all talk and no action

I have traded futures markets since 1975. For those of you who failed basic math, this means I have traded for almost 40 years. I have seen every conceivable market situation.

Every market has its perpetual bulls and perpetual bears. But of all markets, Silver attracts the most fanatical bulls of all. When Silver bulls are right (BTW, that is not very often — Silver has experienced significant price gains in only five years since 1972) it is because they are brilliant. When Silver bulls are wrong (nearly 85% of the years since 1971), it is either because they have been victimized (by the exchanges mostly) or because most other market participants “just don’t get it.”

So, Silver bulls, here is your chance to scoop up your worshipped metal at an historical bargain price. The charts you publish on your blogs verify this fact. Relative to the vast ever-increasing glut of fiat money printed by central banks, inflation-adjusted pricing or the standard set by some robed Spanish king 500-plus years ago, your metal has never been cheaper.

So, it is time for you to put your money where you mouth is. As a trader I do this every day. I am presently short Gold and Copper. If I am wrong on these trades I will count than as loses, not as part of a grand conspiracy against me. Losing trades are called losses. When I lose on a trade, I am a loser, not a victim.

I have put my money where my mouth is to be short precious metals. If I am wrong — so be it, I am wrong on more than 60% of the trades I do. If I am right, also, so be it. A trade is a trade is a trade is a trade. Silver is something to trade, not an idol to worship. So, it is time to put up or shut up!

A review of the metals charts is in order.

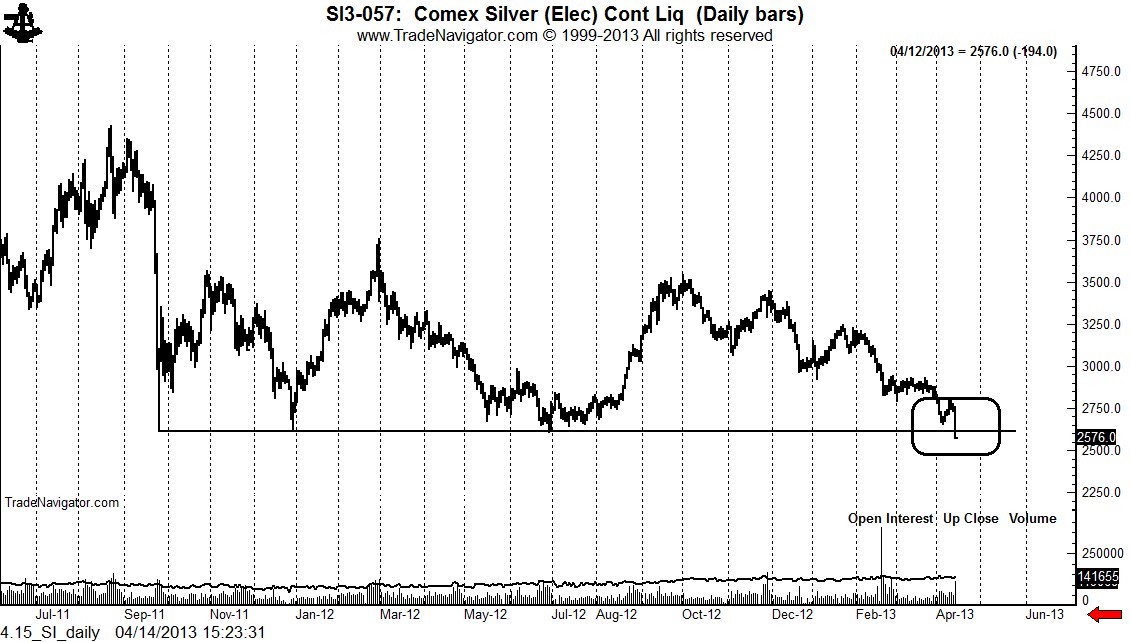
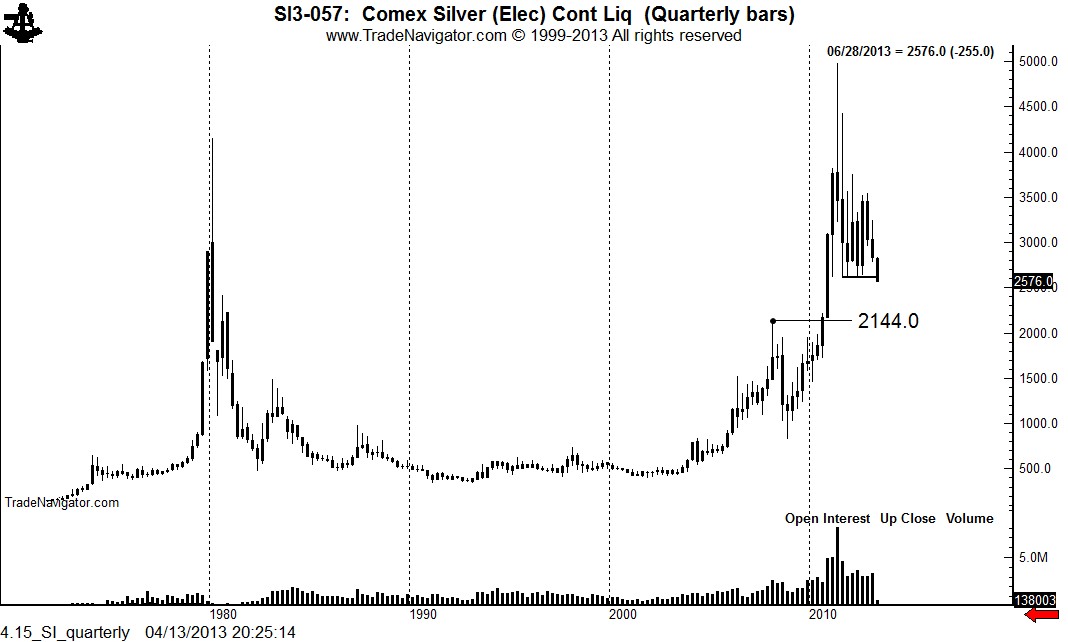
The daily Silver chart has penetrated an extremely important “line in the sand” at 2615. The longer term chart would indicate Silver is headed toward a retest of the 2008 high at 2150+. But, here is the good news, Silver bulls — the market is probably much closer to the lows than to the highs. After all, Silver is getting closer to zero than its 2011 high of $49.

4.15_SI_daily

4.15_SI_quarterly

Actually, the charts in Gold looks more bearish to me than do the Silver charts. Now, this is interesting because I am on record as being a super-cycle bull on Gold. Wait just a minute! I am a long-term bull on Gold, yet I am short! To a Silver bull, this is would be sacrilege. To a trader, this is a trade. That is the major difference between traders and Silver bulls. To traders, markets are just a tool. To Silver bulls, Silver is an idol to worship.

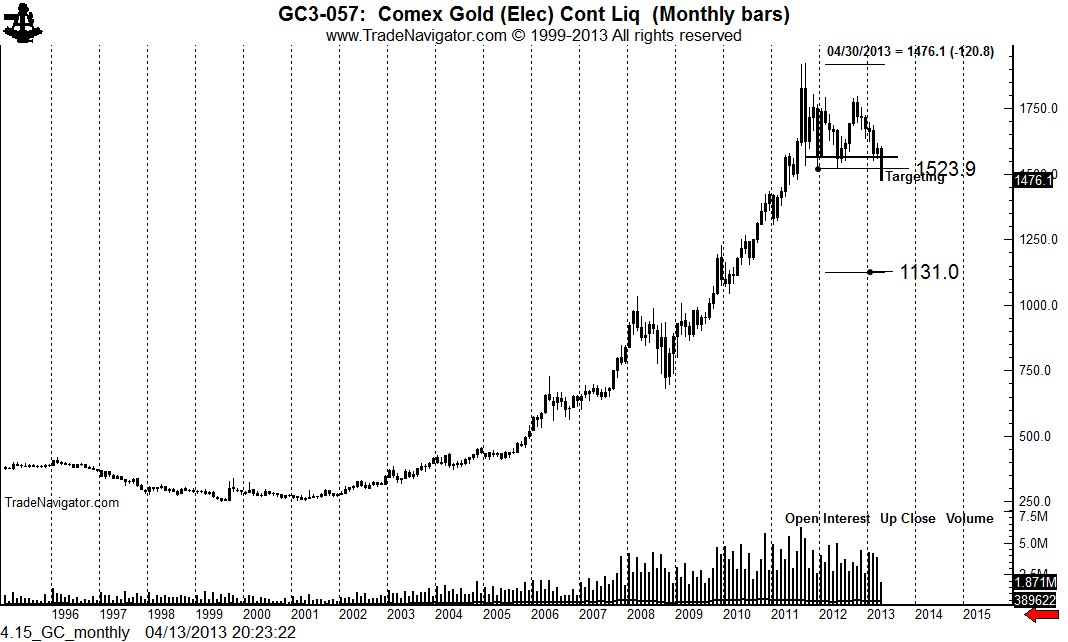
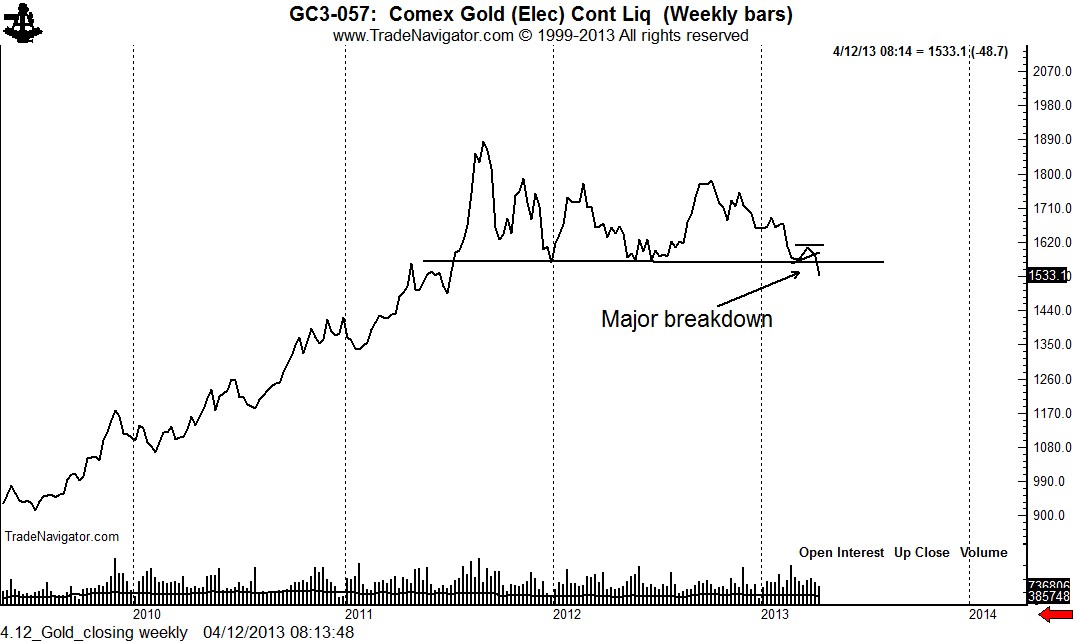
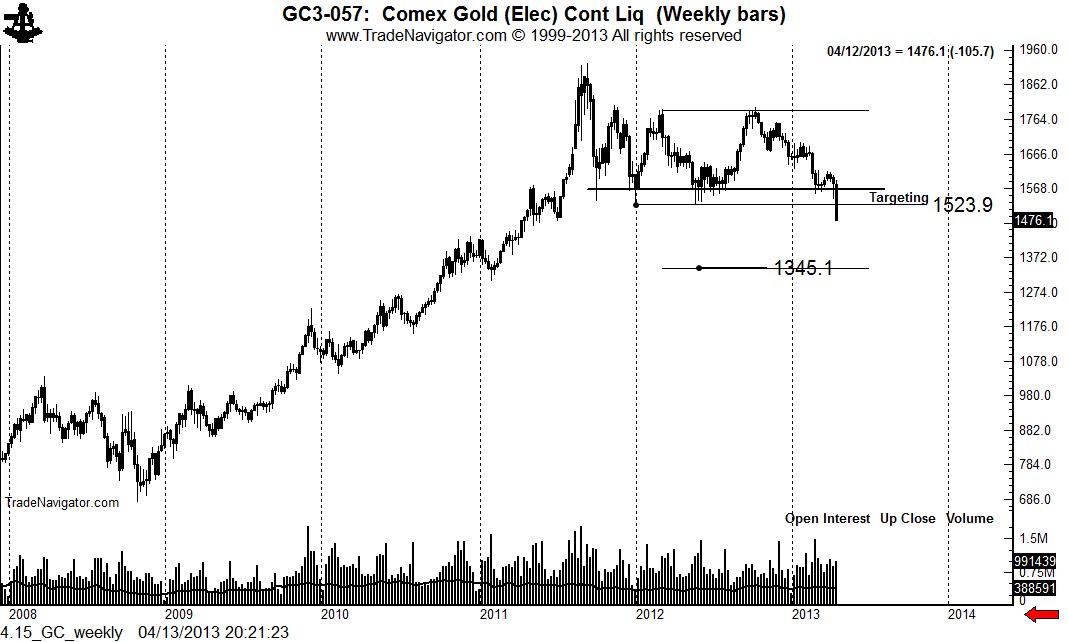
The massive decline on Friday completed a massive top on the daily, weekly and monthly Gold graphs. The charts can be defined by a single word — UGLY! Should Gold rally, short sales in the 1520 to 1540 zone would be highly appropriate. There are various downside targets in Gold depending upon whether one uses a closing price chart, a candle chart or a bar chart. The lowest target I have is around 1131. Do I think Gold can go that low? Not really. But a decline to the low 1300s is very possible. In fact, two days like last Friday and we will be there.

4.15_GC_monthly

4.12_Gold_closing weekly

4.15_GC_weekly

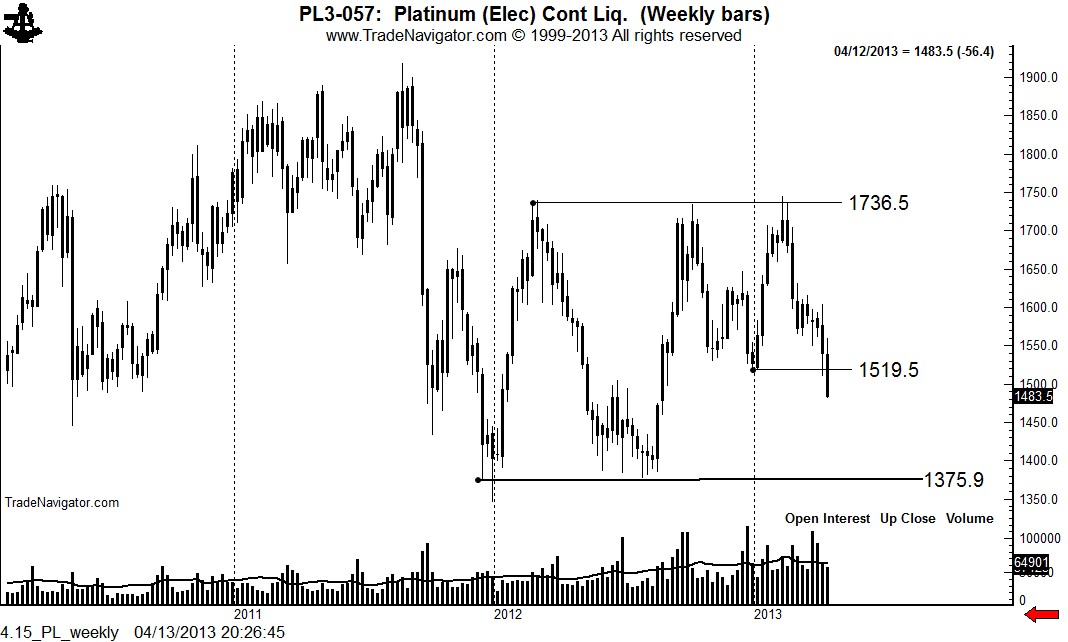
The longer-term chart in Platinum is also negative. The decline on Friday would indicate that the market is headed toward the lower end of its broad trading range at 1375 or so.

4.15_PL_weekly

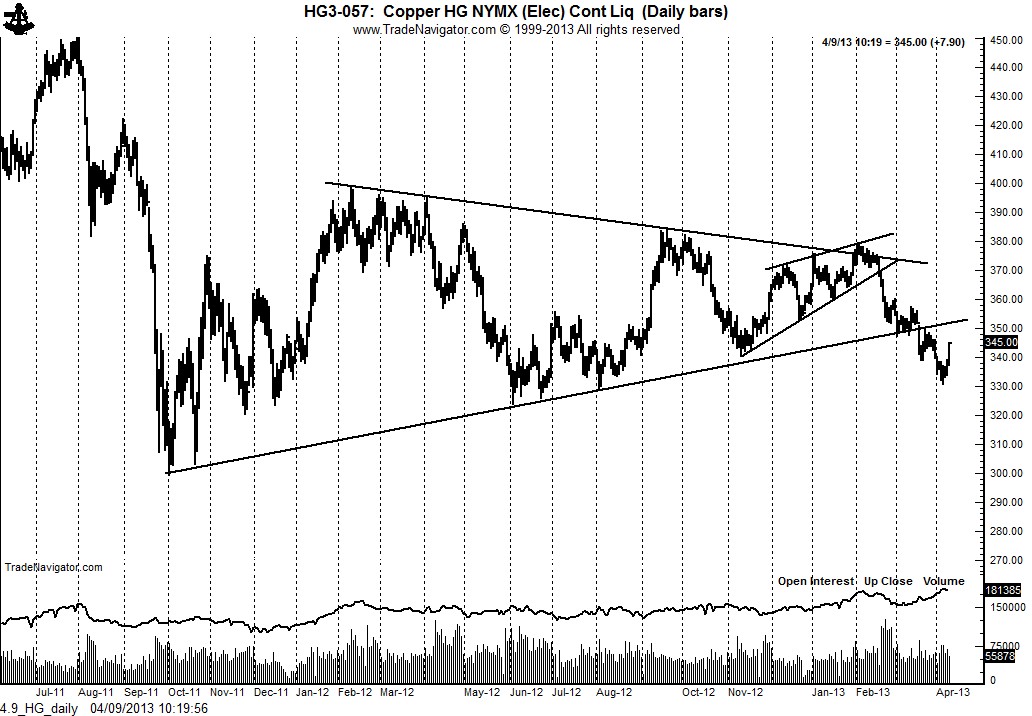
The weekly Copper chart also remains quite bearish, although as I pointed out this past week, the CFTC COT data are extremely constructive. Yet, price is always king, and the burden of proof is belongs to the bulls.

4.9_HG_daily

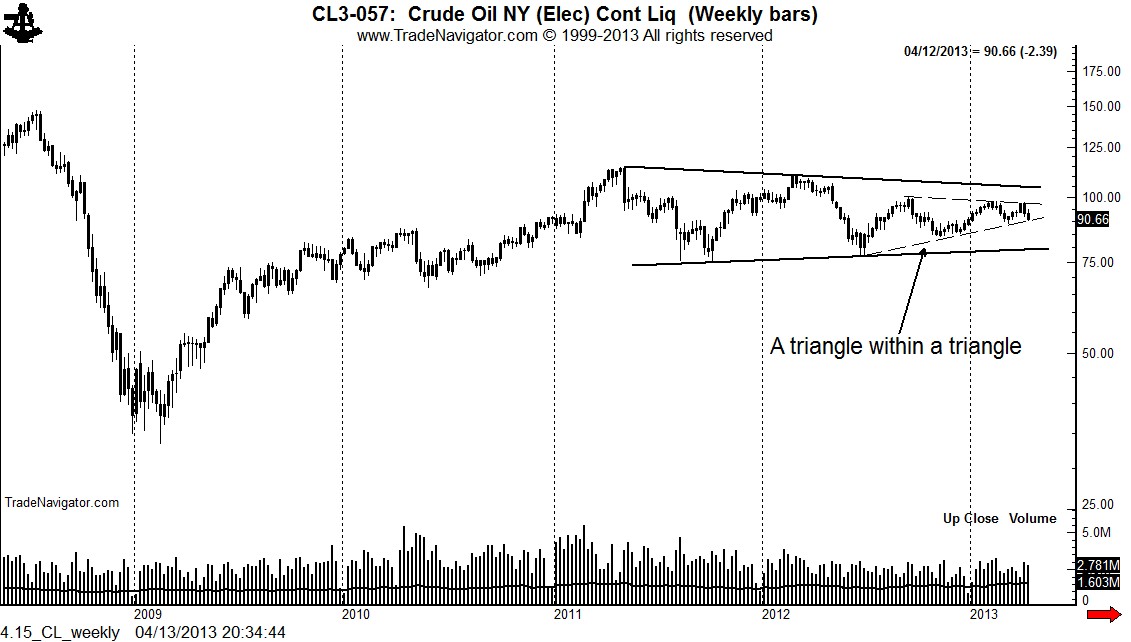
Finally, let me point out another fascinating chart development — in Crude Oil. The Crude Oil weekly chart displays a symmetrical triangle within a larger symmetrical triangle, as shown below.

4.15_CL_weekly

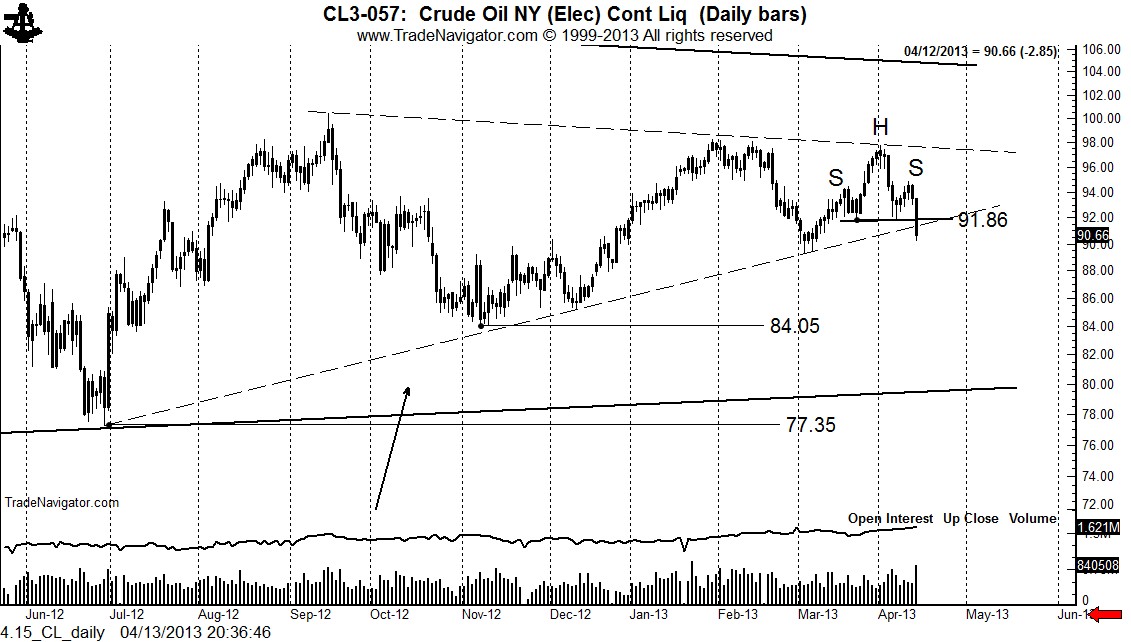
A case can be made that the shorter-term triangle was completed this past week, along with a H&S top pattern. However, this breakout is not yet convincing. The chart indicates a possible target of 77.35. Conventional wisdom holds that there is only one way energy prices can go — up. This is why the 77.35 target is probably correct.

4.15_CL_daily

 $SI_F, $GC_F, $PL_F, $GLD, $SLV, $HG_F, $JJC, $CL_F, $OIL


###


Trading futures- and forex-related ETFs is for fools

It is idiotic to trade an ETF/ETN when the underlying futures contract can be traded

If you cannot see the attached PDF, click here.

[scribd id=115345564 key=key-wftypqzvufr2me01ry4 mode=scroll]


#ETFs, $GLD, $SLV, $UNG, $SPY, $JJC, $OIL, $IAU, $FXE, $UND


###
An excellent example of the “all-one-market” phenomena

It has come to be known as the “risk-on/risk-off” or “all-one-market” phenomena in global markets. It is a situation where seemingly unrelated markets have taken on an historically high correlation. Individual markets seem to be the proxy for all other markets.

I have witnessed periods in the past when unusually strong correlations existed for months and months. But, I have never experienced the level of correlation we have lived with as traders since 2008. There are a lot of theories out there to explain this phenomena. Most of them touch on the global flow of capital, speculative herd instincts, liquidity, the search for “safe havens,” and the like. I will leave the precise and correct explanation to those much smarter than myself.

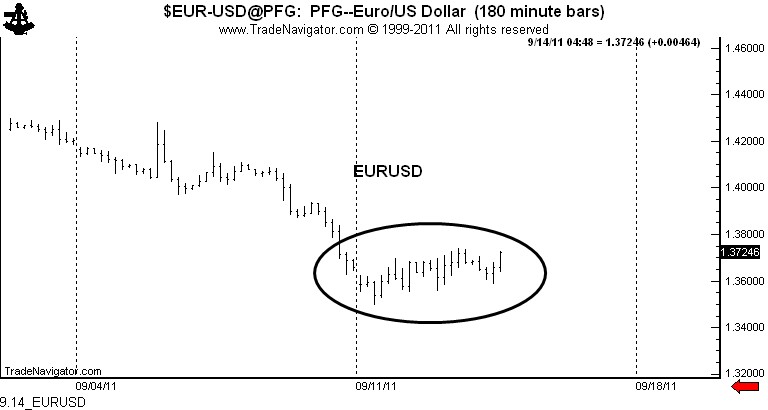
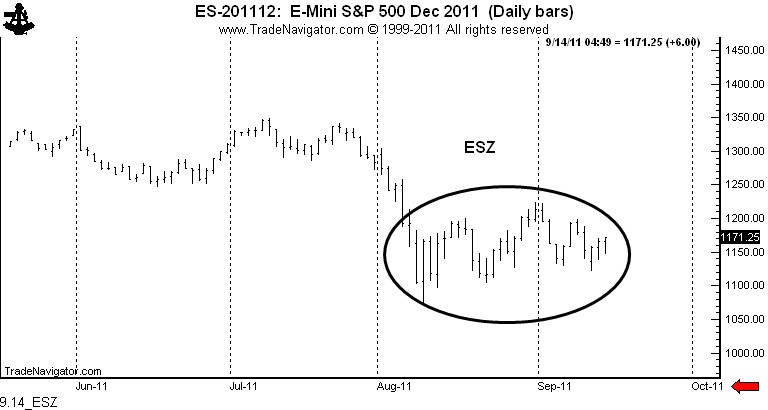
Any way, I have come across near identical chart patterns in three seemingly unrelated markets (although I am sure I will hear a scenario from many of you as to why these markets are not unrelated).

The charts shown below are Crude Oil, S&Ps and the EURUSD. Note that the first two are daily graphs, while EURUSD is an intra-day chart. Seeing the same pattern in different time frames has become known as the “fractal” concept. But, nevertheless, the price behavior of the three markets has been nearly identical during their respective corrective rallies.


Will the outcomes be the same? Will one of the three be the leading indicator? It will be interesting to see. I can say this — the pattern is either very bearish or quite bullish. Talk about hedging my bet? What we see at the present time qualifies as a possible bearish rising wedge of a possible horn or sloping bottom.

My guess is that all three patterns will morph into something different. Big help am I!

Markets: $CL_F, $OIL, $SPY, $ES_F, $EURUSD, $G6E_F

Silver is a cross dresser!

 …and other charts I am watching the week of September 12, 2011

One of the goals of this blog is to focus on the purity of price charts without the clutter of any number of indicators. Not a single chart in Schabacker’s manuscripts or in the Edwards and Magee book contains such indicators as RSI, stochastics, MACD, ADX, DMI, Bollinger Bands, oscillators, %R or the like. Yet, who can question the brilliance of their legacy?

All of these indicators are derivatives of price. I take nothing away from traders who make their living using indicators. All the more power to you! Heck, some of my good trader friends use various indicators. But, in my mind, why should I study price derivatives when I can directly study price itself? Am I discouraging novice traders to avoid the use of indicators? No, not at all! But for me, price is king.

The markets and charts I am watching the week of September 12, 2011 include:

  • Silver
  • S&Ps
  • Nasdaq 100
  • Soybean Meal
  • Soybeans
  • Euro Currency (EURUSD)
  • Canadian Dollar
  • U.S. Dollar Index
  • Crude Oil
  • Rough Rice
  • Sugar

It is highly unlikely that I will become involved in any markets besides these. I select my trading list each Saturday for the following week and I attempt to keep the list intact without additions.

So, here we go, folks

Silver

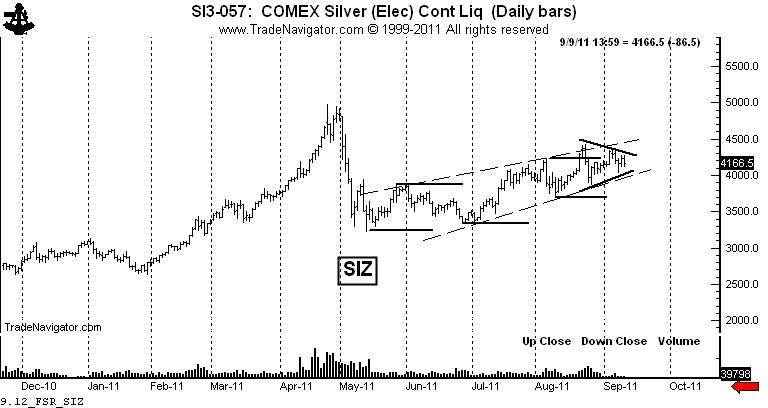
Often times a market will become a cross dresser – putting on bearish clothing one moment and bullish clothing the next. Such is the present case in Silver. Both a bullish and bearish story can be told technically. The bullish pattern is a bull horn, or sloping bottom (solid lines). Note that the final breakout of the horn has stalled in the form of a symmetrical triangle. A move into new highs would complete this triangle and confirm the horn – and establish a target of 52.00.

The bearish narrative is a rising wedge from the June low (dashed line). The same small 4-week triangle is also in play in the bearish scenario. A completion of this triangle in a downward direction should provide the thrust to complete the wedge, establishing a target of 32.50.

I am without a position in this market, but I have the market bracketed with buy stops above and bear stops below.

S&Ps

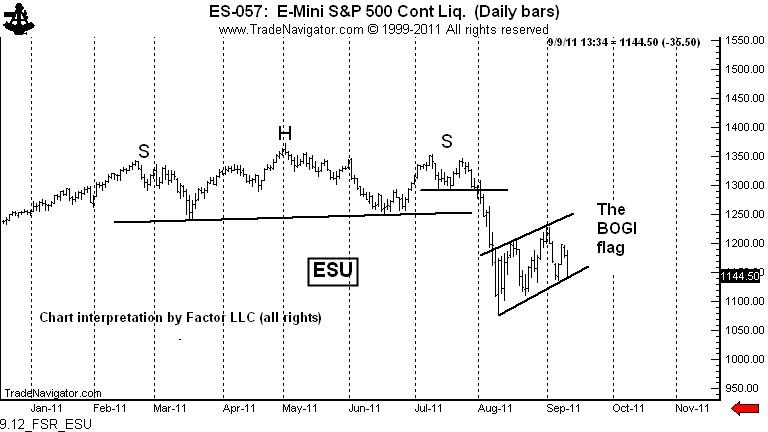
Like all other of the broad stock indexes, the S&Ps are forming a 5-week flag. I continue to view the H&S top completed in early August as a MAJOR reversal in stocks.

I am short two layers. I will attempt to extend leverage next week on any minor rally. I believe that Friday will become to the upcoming decline what August 1 was to the early August decline. I have given up (for the moment) on the idea of a BOGI gap. Instead, I am labeling the flag as the BOGI flag. I will extend leverage further upon the completion of the BOGI flag.

Nasdaq 100

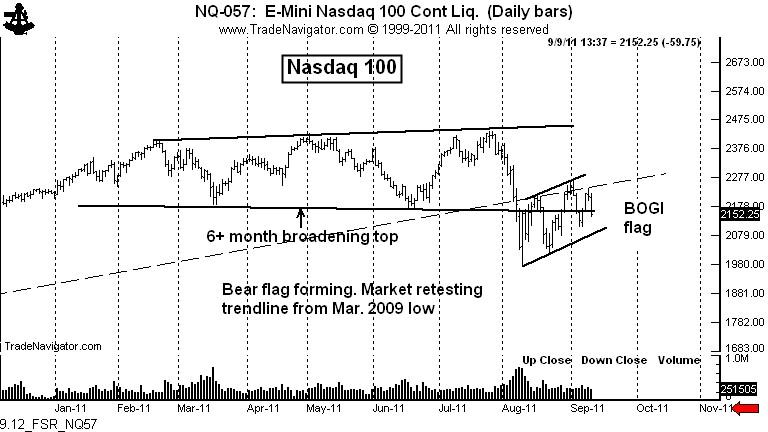
The Nasdaq is forming a flag as a retest of its massive broadening top. The broadening top is a rare, but potentially powerful chart pattern. According to Schabacker, “In most cases a rally will develop shortly after the level of the fourth reversal has been broken, and in most cases this rally will carry prices about half way back….” The retests of broadening tops are notorious for digging back into the completed pattern.

In fact, the retest rally in the Nasdaq retraced 55% of its July to August decline. I believe this flag will resolve itself in the direction of the broadening top with a flag target of 1899, slightly lower than the target from the broadening top.

I am short one layer, looking to extend short leverage. I think that Friday will be the counterpart to the upcoming decline as July 27 was to the first major leg down.

Soybean Meal

A firm retest of the underlying rectangle took place this last week. The market seems to lack any ability to rally. We will see if this retest holds. A move below the August 22 low negates the rectangle. I am fully committed to the long side. I do not have a very good feeling about this trade, but I am not willing to trump my trading rules to satisfy my feelings.


Soybeans

The daily Soybean chart is almost identical to the Meal chart. A break below last week’s low will begin to put the bull trend in Soybeans into doubt. I will buy a retest of this past week’s low with very tight protective stops.


Euro Currency (EURUSD)

The decline this past week resolved all of the confusion of the past 4 to 5 months on the daily chart by completing a decisive descending triangle. To label this price action as a descending triangle I am ignoring the one-day spike down in July. It was an event Edwards and Magee define as an out-of-line movement. The descending triangle has a target of the test of the January low in the area of 1.2900. I am short one layer.

Canadian Dollar

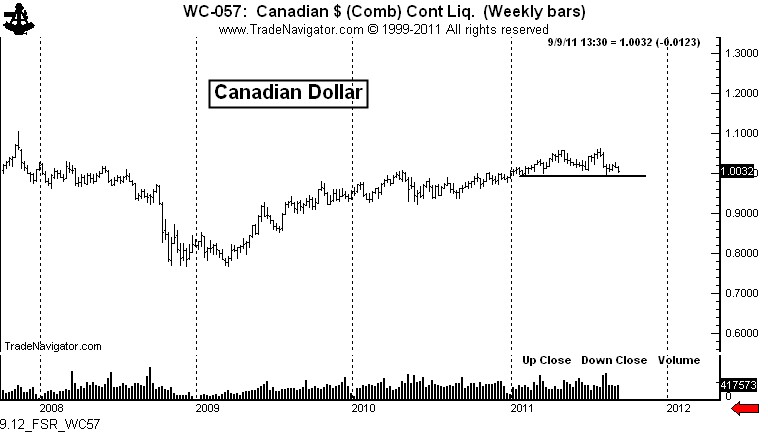
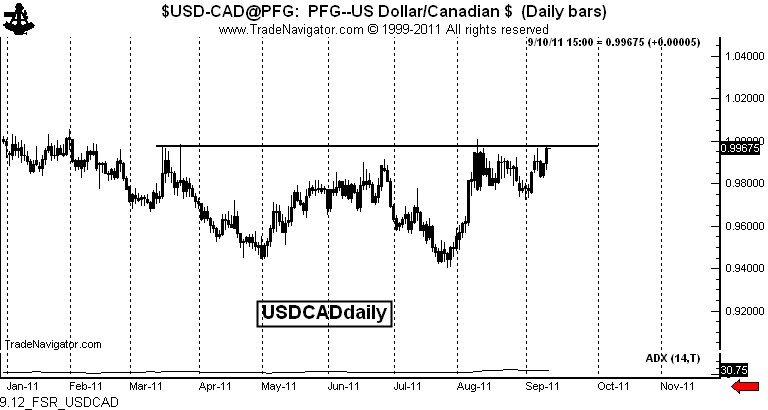
Two charts are shown. The upper chart is the weekly CME futures contract. This chart displays a possible double or “M” top, requiring a close below par (1.0000) for completion. The lower chart is the daily graph of the spot USDCAD which trades at a reciprocal value to the futures. Thus, the spot chart shows a possible bottom pattern, requiring a close above 1.0000. I will wait for the completion of this pattern before taking a position.


U.S. Dollar Index

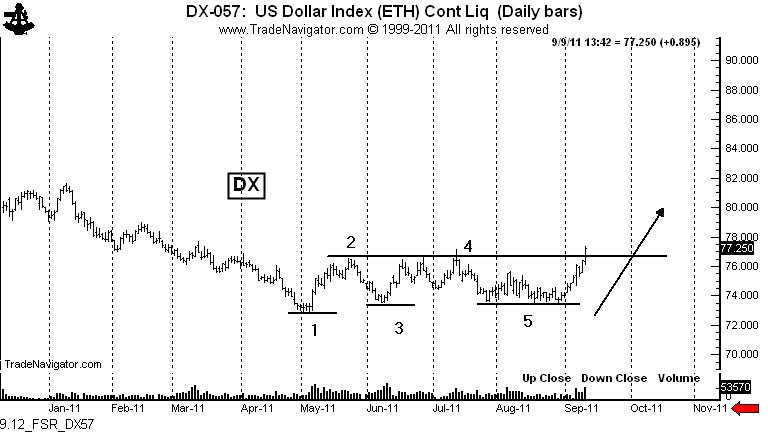
The market completed a rare triple bottom on Friday. This bottom is almost identical to the DX bottom in 2008 (not shown). The target of this pattern is 81.50. I am long one layer.


Crude Oil

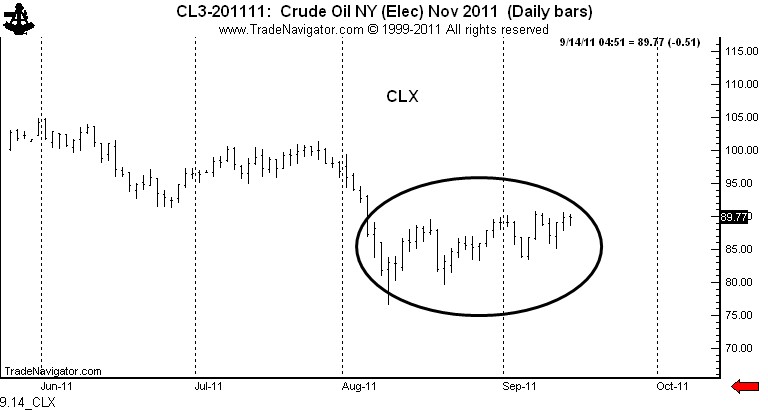
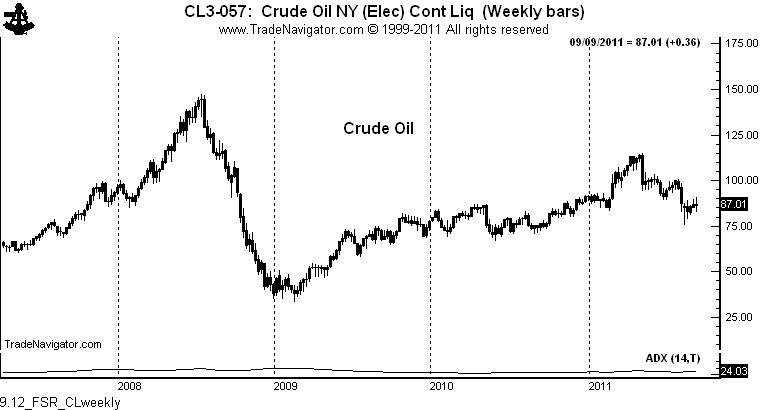
The Crude Oil is setting up for another leg down in a bear market that began in May. As shown on the weekly chart, there is plenty of empty air underneath the market.

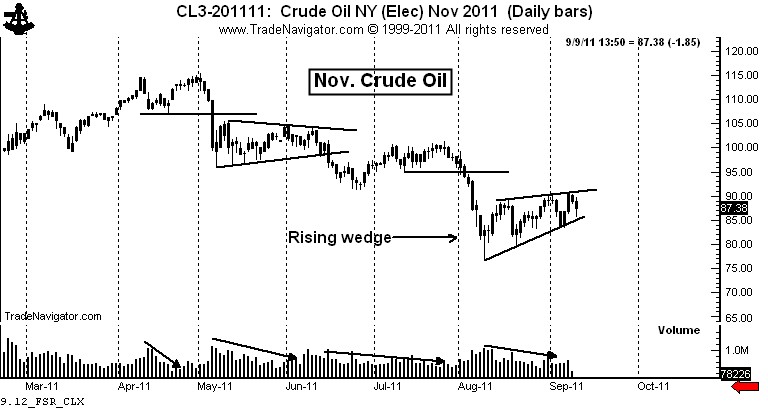
The daily chart displays a 5-week rising wedge. Normally this is not a long enough pattern for me to trade, but given the strong downtrend I will short this market if the wedge is completed. The CFTC COT data shows that the commercials continue to be significant sellers of futures. Notice how volume has dried up during all sideways periods. This volume profile confirms the major bear trend.

Rough Rice

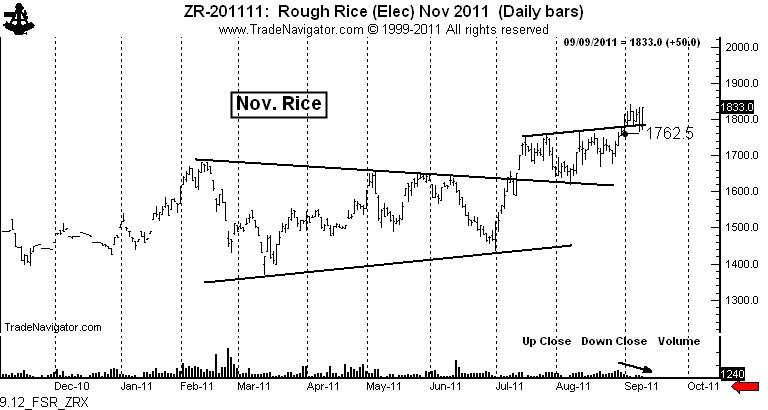
The market has now confirmed the completion of the 7-week inverted continuation H&S on the daily chart (top graph), which in turn, confirms the 5-month triangle on the daily graph, which in turn confirms the massive 5-month H&S bottom on the weekly chart (bottom graph). The target is 2280. I am long one layer.


Sugar

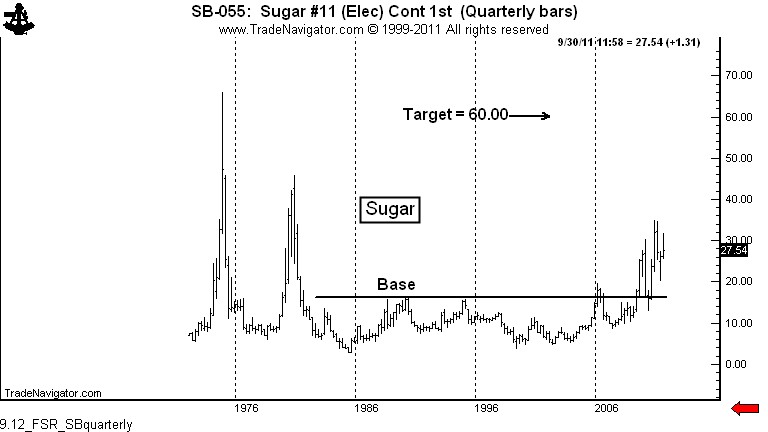
I want to once again show the quarterly chart. The massive base completed in 2009 is the dominant pattern driving this market. This base has an eventual target of 60 to 70 cents – and this has biased my interpretation of the daily charts for the past two years.

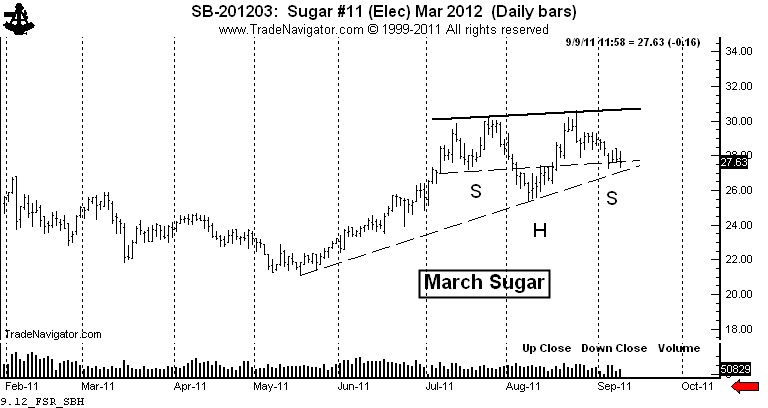
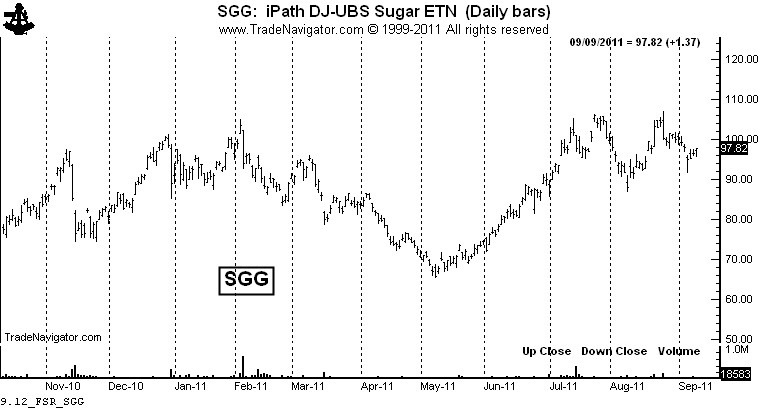
The daily chart (March) is forming a possible 2-month continuation H&S pattern. I have bought this market in anticipation of a right shoulder low. I am not sure this will prove to be a successful trade, but the reward to risk ratio is quite favorable with this maneuver. If the market can hold last week’s low I will attempt to quickly build leverage. The Sugar ETF, SGG, is also shown.

I am basically willing to bet that this current area of consolidation will lead to another leg of this bull trend. If my foundational bias is incorrect I will almost surely be wrong on the majority of my trades in the months to come.

 Markets: $QQQ, $NQ_F, $SPY, $ES_F, $ZM_F, ZS_F, $SB_F, $SGG, $USDCAD, $G6C_F, $FXC, $ZR_F, $EURUSD, $G6E_F, $FXE, $DX_F, $UDN, $UUP, $CL_F, $OIL, $$

###