Tag Archive for: SI_F

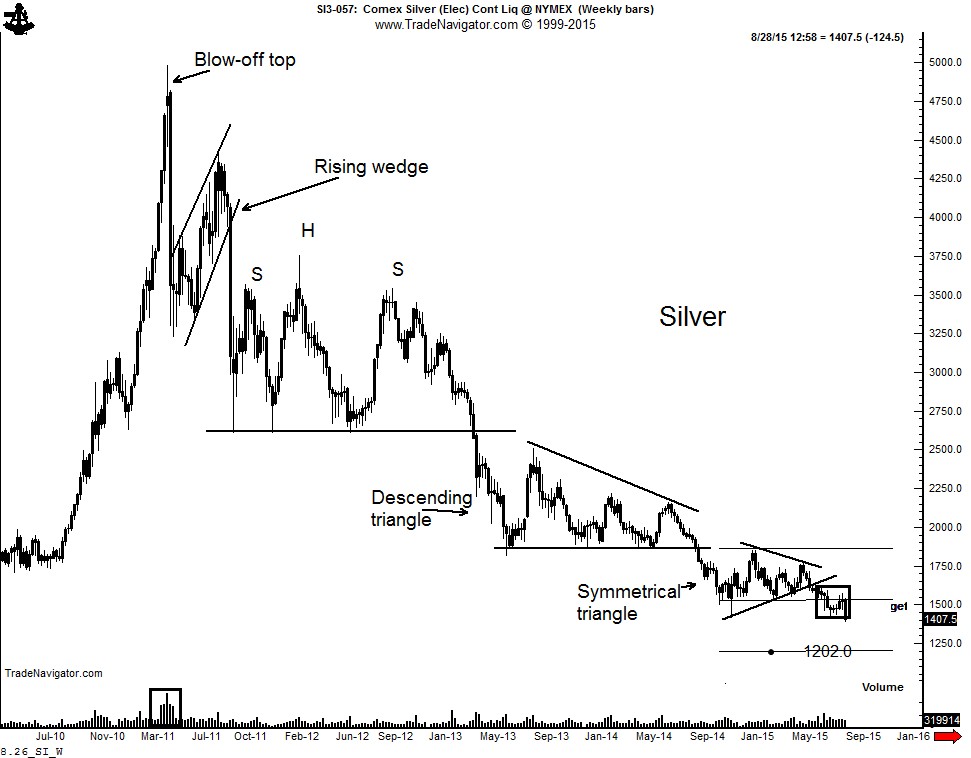
The bearish case in Silver is back on the table

Seven month symmetrical triangle has been confirmed

Decline on August 25 triggerd an 8-week H&S failure

In recent weeks I have presented to members of the Factor Service the possibility that  why The Silver chart is a textbook example of the veracity of classical charting principles. Some of the features on the weekly graph include:
  • The blow-off top in April 2011 accompanied by record blow-of volume
  • The rising wedge retest of the top completed in September 2011
  • The continuation H&S pattern completed in April 2013
  • The descending triangle completed in September 2014
  • The symmetrical triangle completed in June 2015
8.26_SI_W Read More

Chart of the Day — with a Hearty Hi-Ho Silver Away

This content is for members only

Putting the current bear markets in Gold and Silver into a longer-term perspective

This content is for members only

Chart patterns I am watching this week

This content is for members only

A bearish technical case for precious metals

This content is for members only

Have precious metals begun a new bull market?

This content is for members only

Silver may be losing its remaining tarnish

This content is for members only

Chart of the Day — What’s next for Silver

This content is for members only

Charts that have my attention

This content is for members only