How random probability theory can make the difference between losing and winning with the same exact trading plan
This content is for members only
On June 28, I posted a chart that overlaid Silver prices today with Silver prices in 1980 (see here). I saw the two periods as an example of analog price behavior. My conclusion was that — based on price behavior of the 1980s — Silver was headed to $20. At the time of the post I felt strongly about the market prediction.
Then on July 4 I added a post titled, “A potentially bullish development in Silver.” Based on the newly released CFTC Commitment of Traders data, I saw a new development in the Silver market.
Of course I got hit with some snide comments — “How could I be a $20 bear one day and start changing my mind just a week later?”
One of my favorite web posts of all time was by a trader I greatly admire, Barry Ritholtz, author of the blog The Big Picture. Barry is an astute market participant and observer. The post, from July 24, 2006, was titled “Strong Opinions, Weakly Held.” This blog, and the management philosophies it discussed, perfectly describe why I could hold strongly to a bear bias in Silver one week, and start to think differently just a week later.
Barry ended the post with the following sentence: “The bottom line is that strong opinions, weakly held is a mindset more investors need to familiarize themselves with.” I could not agree more.
Barry’s blog post was founded in the academic work of Professor Robert Sutton who teaches Management Science and Engineering at Stanford. Sutton’s work sought to distinquish between what was “smart” and what was “wisdom.”
As Ritholtz stated, “Being a successful investor often requires you to hold numerous conflicting concepts simultaneously — something many the average phyche has difficulty with. One must think through the best possible analysis for your positions, expend the time and effort to thoroughly test them. You need to be able to strongly argue your position — bullish, bearish or cash — but at the same time, be ready to admitt error and change views.”
When I express an opinion about a particular chart, it is most often a strongly held opinon. Keep in mind that for me a strong opinion does not necessarily equate to a trading position. Trading positions are brought about by a strong opinion PLUS a specific technical set up PLUS a favorable reward to risk relationship.
Strong Opinions, Weakly Held! What a great concept for a trader.
$$Study
###
Yesterday’s drop in $EURUSD highlights the extremely short-term view of many traders in the StockTwits stream
This post is sure to step on some toes…but I have stepped on toes before and I will step on toes in the future. So here goes…
Let me emphasize that what I have to say in this post is not aimed at all participants in the StockTwits stream. There are many excelllent analysts, traders, risk managers and bloggers in the stream. You know who you are from your brokerage statements.
But, the StockTwits stream contains a significant amount of thinking and market manuevers that are — in my opinion — dangerously short term.
Yesterday morning I came into the office to find the $EURUSD down about 200 pips and experiencing the completion of a major bearish triangle. Not being a regular follower of fundamentals, I went to the stream to find out the reasons for the weakness. Within a matter of minutes, here are some of the stream posts I read:
Frankly, I could not believe what I was reading. To make myself clear, I am not against a tradng system that includes a component for buying or selling a market based on a return to the mean from a price that is a certain number of standard deviations out of line. But, this was not the spirit of what I was reading.
Rather, I sensed way too many traders attempting to catch a falling knive because they missed the move down. And to me, this was an indication that the StockTwits stream has many market participants who make a habit of standing in line to pick up nickels when the next line over is handing out dollars.
If you consistenly make money catching knives, all the more power to you. I will never fault a person who has figured out a way to make a living from the markets. But, I strongly believe that such short-term trading is dangerous for many novice and aspiring traders for two reasons.
The first reason is that small miscues, misjudgements, execution snaffus and the like exponentially add up to become major hurdles to success as a trader’s time horizon shrinks. The second reason is that really significant trading profits come from the practice of holding positions and not by active trading. Additonally, the shorter term a trader becomes, the more he or she is competing with sophisticated HFT operations. And, whether a short-term trader uses market or limit orders, they need to know that they are buying at the offer and selling at the bid. HFT operations, in contrast, manipulate the computer trading environment in order to buy at the bids and sell at the offers.
So, if the shoe fits from what I have described, then wear it. If it does not fit, then ignore it. But if you have been standing in the nickel line and are unhappy with your overall trading results, I suggest you move over to the dollar line.
$STUDY
###
Spread will eventually return to $1.75 premium Wheat
On June 9, the Wheat vs. Corn spread made a new all-time historic low of 40 cents premium Corn. This broke the previous low of 11 cents premium Corn from November 1983. Over the years the lower band in the spread has been around 10 cents premium Wheat, as shown below.

The spread has rallied sharply from the June 9 low and is now about 23 cents premium Wheat. I think it is a fair assumption to say the spread will NOT retest the June low. Unfortunately the forward spreads accept this reality. The December 2011 spread is at about 70 cents premium Wheat. Just four months ago this spread closed at $3.68 premium Wheat.

Tightness in Corn could continue throughout the growing season and this could drive the December 2011 spread toward 40 cents premium Wheat. The new crop spread should be bought in this area. Historically the Wheat vs. Corn spread will return to about $1.75 premium Wheat within a year or two after trading near parity.
Markets: $ZW_F $ZC_F
###
The chart of July Soybeans is very instructive for traders using classical charting principles (Edwards and Magee or Schbacker).
As a starting point, no two classical chartists may label a chart in the same way. And even if some classical chartists agree as to pattern identification, it does not mean that:
I had labeled the July Soybean chart as a 16-week symmetrical triangle. By the way, the morph rate on symmetrical triangles is quite high. Nevertheless, the pattern was mature enough that I bought the breakout on June 2 at 1402. My initial stop was based on my Last Day Rule principle (see Diary of a Professional Commodity Trader book for an explanation of this rule). The LDR price of 1383.6 was violated on June 7, stopping me out. I lost about 50 basis points on the trade.

I still have the chart labeled as the same symmetrical triangle, and view June 2nd and 3rd as a premature breakout — although the breakout could prove to be a bull trap of significant magnitude. I will receive a secondary completion signal if the market can clear the June 3 high at 1419.4 or close above the upper boundary line of the triangle (about 1404). As of this writing, July Soybeans are trading at 1402, not high enough to trigger an entry signal. If an entry signal is generated at the close, the new Last Day Rule will be the low of today at 1385.
I will go long on a secondary completion of the pattern with a risk of 50 basis points (1/2 of 1% of capital). If I go long again and get stopped out, I will no longer follow this market. I give a pattern two chances for a clean breakout.
There is another lesson in this market. I have recently written about my dismay with high/low bar charts because of the noise factor. I have a strong bias in favor of closing price charts. On a closing price chart, August Soybeans completed the symmetrical triangle on June 2, but has not violated the pattern. A close below the May 31 close at 1372 would be required to violate the pattern.

Using closing price charts raises the subject of not using intraday stops, but rather using “stop-close-only” orders (real or mental). I discussed this idea in my blog posts titled “Lessons from a difficult year of trading” on May 24 and “Stops or no stops – a response to StockSage1” on May 25.
From a tactical point of view, using close-only stops (or much wider intraday stops) means that a trader must downsize his or her leverage or sizing in order to limit the risk of a trade to a certain basis point loss. Ideally, while the profit potential per winning trade would decrease with smaller sizing, the win/loss ratio would improve over an extended period of time in a manner to hopefully offset the lower leverage per trade.
Well, that’s my brain drain on this subject for now.
###
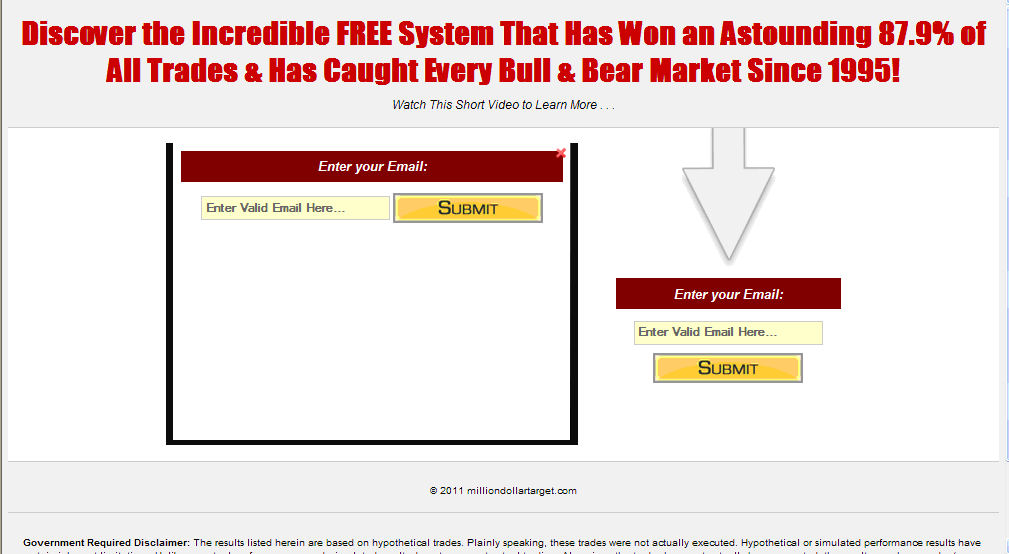
I plead with all you newcomers to trading, please don’t get caught in this trap.
Trading is hard work. There are no short cuts. Tuition is required, and the markets decide the amount of the tuition.

Yet, every year thousands of newcomers to trading get trapped by con artists such as the people behind this email ad. There is no such thing as a trading system that is accurate 88% of the time.
Enter scams such as this at your own risk.
P.S. The bottom of the ad, in tiny print, contains the sentence, “These trades were not actually executed.” That tells it all.
###
![]()


