Tag Archive for: UNG

Is it a massive Natural Gas Head Shoulders bottom - Factor trading - Peter Brandt

Is it a massive Natural Gas Head & Shoulders bottom?

Is it a massive Natural Gas Head & Shoulders bottom?

I last covered the Natural Gas market within the public blog back on June 20th, with the post “Natural Gas Rising“.  Natural Gas posted a 21-year price low in Mar 2016 and the bottom took the form of a 7-month Natural Gas Head & Shoulders bottom on the daily and weekly charts. The target of this H&S at 2.934 was quickly met on Jun 29. The Factor participated in this H&S pattern in its proprietary account and discussed the pattern within the Factor member Updates (See here for details on the Factor Service).


Natural Gas Head & Shoulders - Monthly chart - Factor Trading

Read more

Natural Gas — A massive H&S bottom?

Natural Gas posted a 21-year price low in Mar 2016, as shown below on the quarterly graph.

1The bottom took the form of a 7-month H&S bottom on the daily and weekly charts. The target of this H&S at 2.934 was quickly met on Jun 29. The Factor participated in this H&S pattern in its proprietary account and discussed the pattern in the Factor Update.

Read more

Natural Gas Rising - Factor - Peter Brandt

Natural Gas Rising

Natural Gas Rising

The dominant chart construction in Natural Gas is the completed 7- month H&S bottom on the daily graph (Oct contract). Note the appearance of a possible 6-day flag on the Oct chart.  Factor is long Natural Gas and members were alerted of this buy with our premium reports section.

Natural Gas Rising - Factor Trading - Peter Brandt

The chart of the soon-to-be nearby Aug graph displays a pennant, not a flag (see below). The difference is that a flag is a diagonal correction while a pennant is a horizontal correction. A pennant is more constructive than a flag. That the nearby Aug Natural Gas contract displays a pennant while the Oct contract displays a flag is a constructive indication – in my opinion, for whatever that is worth.


Natural Gas Rising - Factor Trading - Peter Brandt


Factor Membership is now available.  You could consider your membership in the Factor Service as just one more trade. If the Factor Service is not of value to you, well, it is just one more trade that did not work.   Through the Factor Service I endeavor to alert novice and aspiring traders to the many pitfalls you will face – and to offer advice on overcoming those pitfalls. My goal is to shoot straight on what trading is all about.  For more information, visit the home page here.  Or watch my 30 minute webinar where we cover the Factor service in depth.

I hope you will consider joining the Factor community.


sig


##


Trading futures- and forex-related ETFs is for fools

It is idiotic to trade an ETF/ETN when the underlying futures contract can be traded

If you cannot see the attached PDF, click here.

[scribd id=115345564 key=key-wftypqzvufr2me01ry4 mode=scroll]


#ETFs, $GLD, $SLV, $UNG, $SPY, $JJC, $OIL, $IAU, $FXE, $UND


###

Charts I am watching, week of July 22, 2012


I will periodically share a copy of the weekly market update I have sent to a private list of professional traders since 1981. I send this as part of a “market-idea exchange” among the group of these traders.

[scribd id=100773085 key=key-10o0fxuqbpm5630fvyot mode=list]


Markets:  $ZM_F, $ZC_F, $ZW_F, $ZB_F, $GC_F, $SI_Z, $NG_F, $USDCHF


GAZ — an ETF that is full of hot air


Playing the Natural Gas market via ETFs is a fools game — the ETF prices have nothing to do with reality

This past week I got into an intersting email discussion with Kid Dynamite, a fellow blogger. KD publishes Kid Dynamite’s World and his insightful Tweets can be followed at @KidDynamiteBlog

Our discussion centered on his keen observation that the price of some ETFs have everything to do with pure speculation, technical trading and the complicated structures and mechanisms of the ETFs and nothing to do with the price of the underlying assets.

The ETF in question was GAZ — an ETN that is hypothetically designed to track the price of Natural Gas via the Dow Jones UBS Natural Gas Sub Index. The reality is that the price of $GAZ in recent weeks has had nothing to do with the price of Natural Gas. This divergence has to do with the way these ETFs are created. KidDynamite posted an excellent article on this over the weekend — check here for the post titled “GAZ – the ultimate greater fool trade.”.

The daily charts below show the prices of the May Natural Gas futures ($NG_F) and our current villain, GAZ. As you can see, prices of the ETF and the underlying commodity have diverged since the January low with Natural Gas drifting into a new low while GAZ is undergoing a bull thrust.

This divergence between $GAZ and $NG_F tickled my interest, so I examined the relationship over the past five years between the following:

  • Natural Gas futures — the nearby futures contract
  • Natural Gas futures — Dec. 2012 delivery contract
  • $UNG – ETF
  • $GAZ – ETN
  • $FCG – an ETF representing companies with significant stakes in the Natural Gas market

All of these markets have experienced significant declines from the 2008 high in energy prices. But, the declines have varied widely — to the point one must question the correlation between the underlying commodity and the ETFs supposedly tied to the underlying commodity.

The table below shows the price increase needed by the different markets to recover the ground lost since the 2008 highs.

Investors who bought FCG at the 2008 high need only a 156% increase to break even (dividends excluded). Traders who have been long the nearby futures contracts (rolling it forward each month) need a 585% increase in the cost of Natural Gas to break even, athlough this is understated because speculators would have lost additional money on each roll.

But, buyers of UNG and GAZ need a 2,753% and 1,402% respective rally to get back to the 2008 highs. This is not exactly what I would call a good correlation with the underlying asset. Keep in mind, GAZ and UNG are NOT ultra ETFs which one would expect to experience a much greater decline than their underlying assets.

These shocking statistics should alarm traders who think that commodity-specifc ETFs are anything more than vehicles for speculation — and a path for huge profits for their creators.

GAZ has the ability to divert from the underlying because the price of GAZ really has no connection with reality. This highlights a real dilemma with commodity-based ETFs compared to the futures market. Futures market contracts are subject to delivery and expiration, forcing prices between futures contracts and the underlying commodity to converge.

By contrast, there is no exacting mechnism to keep honest the ETFs and ETNs hypothetically linked to commodities or commodity indexes. The price of ETFs such as GAZ ultimately could go wherever the force of speculative fever wants to take them. Whereas I trust KidDynamite to explain the technical reasons for the GAZ, I am much more concerned with the trading implications for all commodit-specific ETFs.

I believe that this disconnection with any reality other than the actions of speculators and manipulation by orignators will be the ultimate downfall of commodity-specific ETFs. At some future time the creator of these derivatives will need to find a way to actually have the derivatives live in the same world occupied by the underlying assets. Until this happens, traders engaging with commodity-specific ETFs need to know they are just playing craps.

GAZ and similar ETFs are full of hot air. If you have contrary thinking (reasons why these ETFs have some economic connection with reality) please reply on this post.

Markets: $NG_F, $GAZ, $UNG, $FCG


.

###

Bottom to Natural Gas at long last


The January low is very likely to hold. Yet, there is no easy way to go long this market due to carrying charges and the premium of the ETFs and deferred futures contracts.

While prices could dip below the 2.300 to 2.500 level again (and if they do futures trades should do somebuying), it is not likely prices would remain there long. In fact, the retest this week may be all we get. The huge spike in volume along with the vertical drop in recent months are characteristic of a market bottom. The problem is that there is no profitable way to play the market. The carrying charges will continue to be a hurdle to playing the market from the long side. Specifically, while nearby Nat Gas futures bottomed at 2.2890 on Jan 23, the Feb 2013 contract is presently trading at 3.6000. Thus, the cash market needs to advance 57% from the Jan 2012 low to keep the Feb 2013 contract from expiring in the red.

The chart below is for UNG, the natural gas ETF. Notice the huge volume spike in the past few weeks. There are about 180 mil shares outstanding in UNG. In the three weeks ending Feb 3 a total of 503 mil shares traded. I believe this  indicates a major change of ownership as several years of buyers finally threw in the towel and commercial interests covered shorts. This type of volume spike is a trademark of major market bottoms and tops. Copare the UNG volume spike to the volume spike at the top in Silver last April.

Yet, the carrying charge structure of the underlying asset (Natural Gas) will make UNG a difficult bet even at these prices .

So, while spot prices have probably hit an important low there is no neat and clean way to buy this market due to the huge carrying charges. However, on retests of the low there is probably little risk in scalping the market from the long side.


$NG_F $UNG

.

Owning UNG is a losers game

Late last week I announced that I thought a low was in place in $UNG. I bought shares in $UNG. This post will explains why I made the trade and why the trade is destined to be a loser.

First, why I made the trade. I am a chartists. I am also a trader — not an investor (frankly, anyone who attempts to profit from price change is a trader, not an investor). I know nothing of the fundamentals in Natural Gas. I know our home uses it as source for heating and cooling. That’s the limit of my knowledge of the commodity.

But, as a chartist I had a reason to go long. UNG has been in a sustained bear trend since July 2008. The decline accelerated during late September and early October. Such an acceleration after a major decline is often a sign of capitulation and a bottom.

So, I took a shot that the bottom was at hand. I bought shares under 8.80 with a stop at 8.39. I bought 1200 shares for each $100,000 of trading capital. If I am wrong I lose 41 cents a share, or $492 per $100,000 of capital. Thus, I am risking 50 basis points on the trade .

Next, why owning UNG is a loser’s bet. UNG is the dog of all ETF dogs. Its bark is so loud and shrill it can be heard around the globe. The ETF is fundamentally flawed. The carrying charge structure of Nat Gas makes UNG act as if it is an ultra long instrument.

The table below compares the decline since July 2008 in UNG compared to $FCG (an ETF comprised of companies in the Nat Gas business in various capacities), the nearby continuation contract of Nat Gas futures ($NG_F) and the November 2011 contract of Nat Gas futures.

As the table displays, UNG has been the dog among dogs. This is because of the carrying charge structure of the market. UNG must continually roll its position from one futures market delivery month to a higher priced deliver month.

Even if the spot or cash price of Nat Gas remains the same, UNG is a loser. For example, the November 2012 contract closed on Friday 18.7% higher than the November 2011 contract. If spot prices remain the same, UNG will decline by at leat 19% in the next year. Like I said, UNG is a loser’s bet.

Thus, it is necessary for spot Nat Gas to experience a sharp rally for my long position to have a chance. But I am a trader — even if I caught the bottom I am likely to be out of the trade if UNG advances to 9.90.

If you believe in the long term future of Nat Gas, UNG is not the way to go. Rather, let me suggest two alternatives.

The first alternative is $FCG (graph below). If the spot price of Nat Gas advances, companies in the Nat Gas business will profit (unless the incompetent current administration in DC regulates and taxes the companies out of existence – a real possibility).

Nat Gas futures contracts can also be traded. The nearby continuation chart below is a good indication that the absolute lows are in place. The market bottomed in  2009.


The chart below is the November 2012 contract. Remember, if spot prices remain unchanged, this futures contract will decline to 3.70. A 19% advance by spot Nat Gas will be required for the November 2012 contract to remain where it is right now.

Finally, there are individual issues with the Nat Gas slot that might make great trading vehicles. One in particular is the Williams Companies ($WMB). As showed on the long-term chart below, WMB has the mother of all symmetrical triangles. This chart carries the potential for $65. However, I often wonder if multi-year patterns such as this are just coincidental rather than containing the DNA for some future move.

The daily chart of WMB almost makes me abandon my bearish bias in the U.S. stock market indexes. WMB has a similar H&S top completed in late July, chopped sideways for 8-weeks, had a false breakdown on Oct. 4 — all like the stock indexes — and has done a “V”-extended bottom since. I just wish the volume on the advance was much larger and I could get real excited about this stock in the near term. In many ways the daily chart of WMB has been a twin brother to $SPY since the 2008 high. These two markets should not look so much the same, but they do. Maybe the play is to buy WMB and hedge it against SPY options. Any thoughts on this you options wizards? (I have no history trading options — I wish I knew more about it).

I stand by my statement that UNG has bottomed — and I will stand by it until proven wrong. Then I will change my mind and be off to a different market. The worst that a trader can do is be wrong — and if a trader uses good money management being wrong is not a big deal.

$UNG, $FCG, $NG_F, $WMB


Charts I am looking at for the week of July 18, 2011

Due to a death in the family, this may be my only post of the week.

Following are the charts that have my interest coming into a new week.

$AUDCAD — This forex pair completed a rounding top last week. I am short, but not as short as I would like to be. I will have orders in place to extend my leverage if the market can retest the top.

Silver: $SI_F, $SLV — The rally late last week completed a possible symmetrical triangle bottom. The bulls appear to be back in control in Silver. I do not have a position in Silver futures, but am long $SLV with a stop below last Wednesday’s low. 

Was my forecast for $20 Silver wrong? Right now that is the way it seems. Trading is a marathon, not a sprint. I have some very bad news for all the Silver bulls who are such fond fans of my blog — I was NOT short last week. Sad, but true! I will let you know when I go short. By the way, I always trade with a stop and seldom risk more than 100 basis points per trading event (one percent of capital).  

There is another intrepretation of the Silver chart that is not as immediately bullish. I have a great dislike for chart patterns with diagonal boundaries. The symmetrical triangle is my worst enemy. I much prefer a horizontal chart boundary. Silver has not yet completed a bottom if we use horizontal boundaries to define the trading range over the past 10-weeks, as seen below.

Gold: $GC_F, $GLD — The Gold market completed a text-book continuation symmetrical triangle this past week. I am long Gold futures and Gold ETFs. Gold, unlike Silver, may one day be monetized.

Cotton: $CT_F — I feel like an idiot. I shorted Cotton really well based on the H&S top. I felt like a genius when I covered on Friday, only to have the market go limit down. I really thought the market would cover the opening gap. I got cute — and I doubt the market will let me back in. Big profits are important. I let one get away in Cotton. I should have been adding, not covering.

$EURUSD, $G6E_F, $UUP, $FXE — The decline on Wednesday completed a classic 6-point symmetrical triangle top. This completed triangle has been violated intraday, but not on a closing basis. I am short, using Thurday’s high as protection. I really thought I tagged a good one on Wednesday. The forex markets are vicious.

$USDJPY, $G6J_F, $FXY — The decline last week completed a triangle, but that is not the real story. Friday’s close is the lowest week-ending close in history, breaching the 1995 low (not shown). We may see Bank of Japan intervene next week, or it may be that the BofJ is capitulating until a lower price level is reached (such as 75.00). I am short $USDJPY and fully expect to have the BofJ run me out of the trade.

S&P 500: $SP_F, $ES_F, $SPY — This is my “pie-in-the-sky” chart. The daily graph displays a possible H&S top. If this analysis is correct (big IF), the right shoulder high is in place. This chart needs to be on everyone’s watch list. I am flat, tempted to go short under last week’s low. The CFTC Committment of Traders data released late last week was bearish.

Soybeans: $ZS_F — This is an extremely intriguing chart. I fully expect that this chart pattern will be completed by an upside breakout — whether the breakout has follow through is a different story. I am lightly long Soybean futures with a stop below the July 12 low. I will add if the market breaks out intraday. I will add more if the market breaks out on a closing basis.

All the above charts are fairly long-term in duration. As a token to you shorter-term chartists, I leave you with Crude Oil. I am not in this market and probably will not become involved due to travel, but an interesting story can be told for getting long.

Crude Oil: $CL_F, $USO — If Crude Oil was in a “for-real” bear trend, then the May low should have turned back any and all rallies. Yet, the market has now climbed back above the May low. This is a sign that the May to June decline was a correction, not the start of a new bear trend.

On a shorter-term basis, the market is forming a 7+ day symmetrical triangle. A completion of this small pattern would probably lead to a test of the June 1 high at 104+. See the hourly chart below.

Let me throw in a couple of final charts. For the first time in a very long time I have some encouraging words for the millions of you who think Natural Gas prices are too cheap.

Natural Gas: $NG_F, $UNG, $UNL, $GAZ — Being long Nat. Gas ETFs has been a losing game due to the huge carrying charges that disappear each month. The weekly chart of UNG shows the result of this time decay.

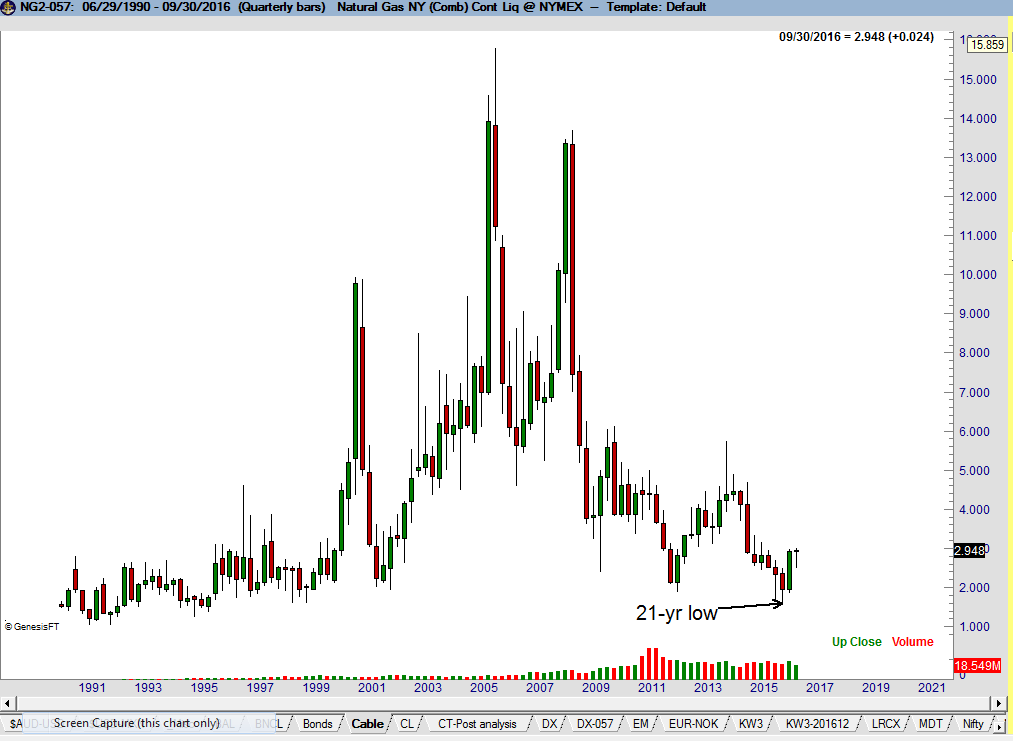
This time decay may continue to take place, but I can say with as much certainty as possible that the physical market has bottomed.  The chart of Natural Gas futures shows that the market has lifted well off the 2010 low and is forming high lows and higher highs.

There is also some signs that UNG has bottomed — the March low may hold, despite the massive supply on hand and the negative publicity on fracking.

While there may come a time to be long the ETFs for the physical commodity, I would prefer to own the ETF for the producers and other companies deriving income from the production and processing of the product. A chart of FCG ends this post.


Markets: $AUDCAD, $SI_F, $SLV, $GC_F, $GLD, $IAU, $CT_F, $EURUSD, $FXE, $UUP, $ZS_F, $SP_F, $SPY, $CL_F, $USO, $USDJPY, $G6J_F, $UNG, $UNL, $GAZ, $FCG
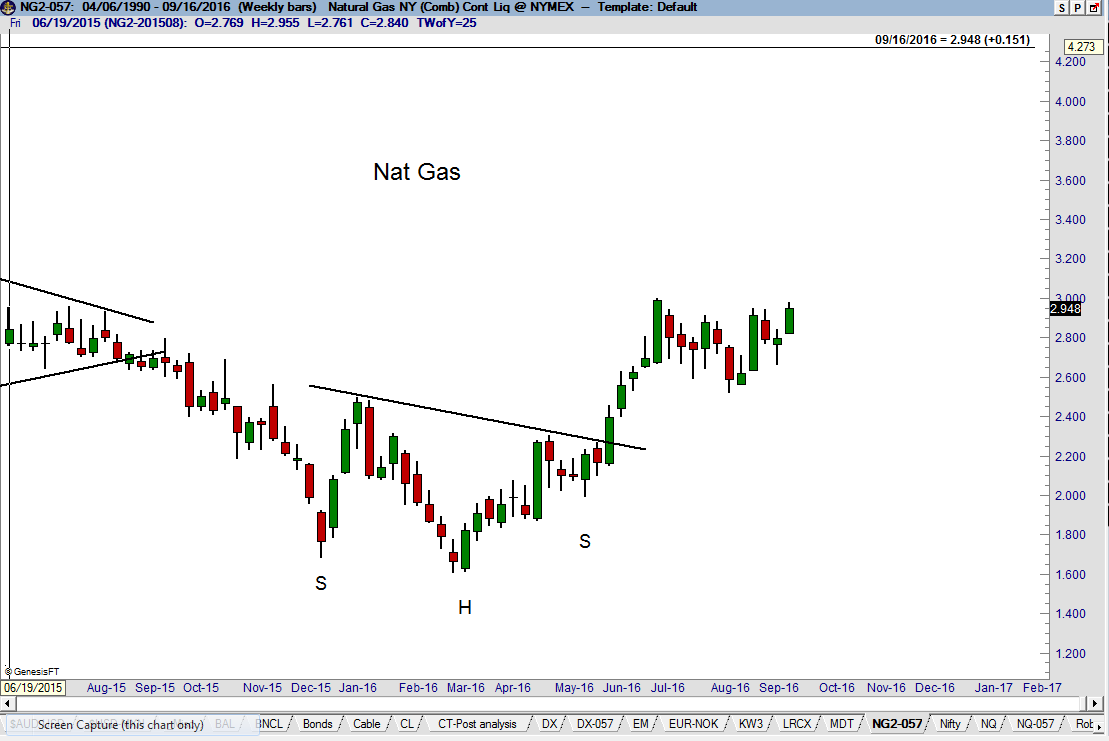
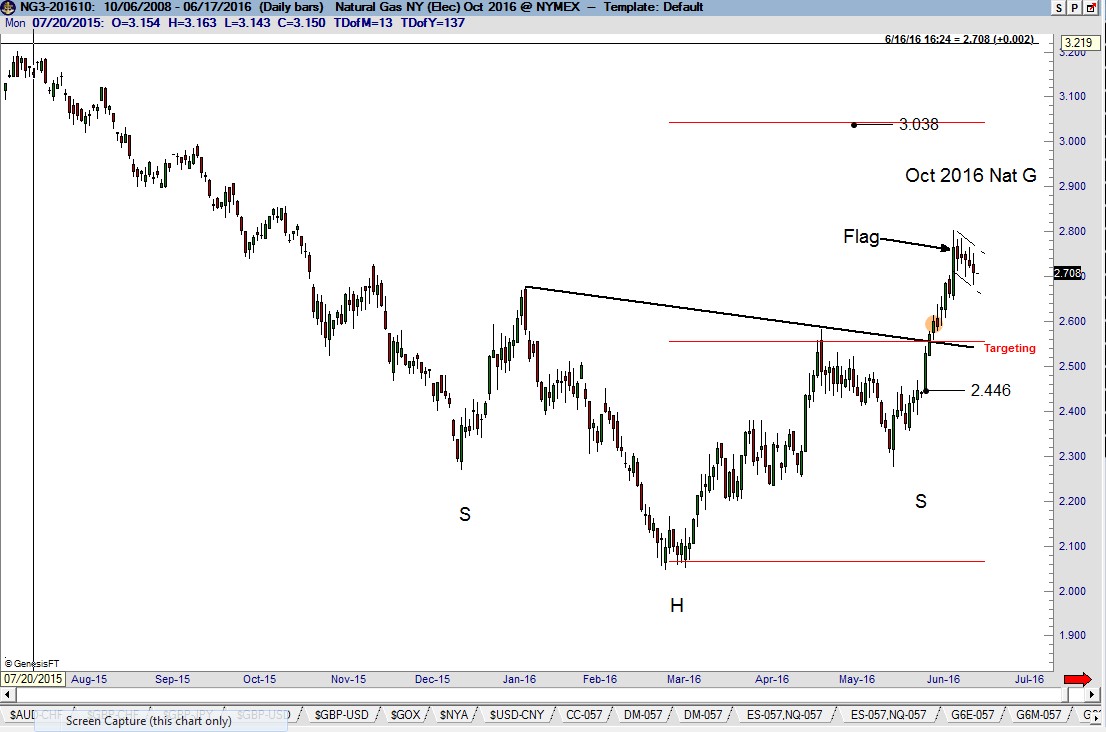
###


Some charts I am looking at now – June 16

There are a few charts that really have my attention right now — although that does not necessarily mean I have a position or will enter a position in these markets. It does mean that I have a position or am looking at strategies to establish a position in these markets.

First, Crude Oil. I have commented several times in recent weeks via this blog or on Chart.ly on the recent consolidation zone. It now appears as though a descending triangle is being completed. Look for confirmation, but be aware that a bear trap could also occur. This is one of those patterns that could provide a head fake to the downside but provide big profits on the upside. But for now, I am short in my proprietary account with relatively tight stops.

Next, I will focus on one of the best potential chart set ups I have seen in a year or so — Natural Gas. The January 2012 contract displays a classic H&S bottom on both the daily and weekly charts. A major bottom is being constructed in this market. I am sure I will comment many times on this pattern and the trading implications in futures and ETFs. [Note: Dan Chesler, an excellent energy market analyst, brought this chart to my attention. Dan’s web site is www.chesler.us]

Next, Copper. I have been bearish on this chart for weeks, but the market is making it hard for position traders who sell weakness. Yet, the market is rolling over. What appeared to be a bear flag has now turned into an awkward 5-week continuation H&S pattern. If the trend has really turned down prices could easily drop $1 per pound in two months.

Next, Soybean Oil. I have had an upward bias in this market based on a possible continuation inverted H&S pattern. However, a sharp drop would complete a H&S failure sell signal. Also, the closing price chart (and I am paying more attention to closing price charts because of increased market “noise”) has completed a symmetrical triangle top. I am presently short Bean Oil, but I will remain flexible.

Next, July Chicago Wheat. If there ever was a H&S top pattern for the books, this is it. The problem is that H&S tops are supposed to occur after a large move up (i.e., tops are supposed to reverse a previous trend). This pattern does not qualify for this criteria in that the pattern itself WAS the move up. Nevertheless, this is a facinating chart worthy of following. I may or may not go short Wheat.

Next, July Silver. This market is in a major bear trend. The daily chart completed a H&S failure pattern on June 13 when the June 3 low was penetrated. I want to make a MAJOR point here, folks. I trade based on set-ups, knowing that 60% of my set-ups will fail over an extended period of time (over shorter time frames in the past, up to 80% of my signals have failed to produce profitable trades). I comment on set-ups, not on market opinions.

Finally, DYY (the ultra long commodity ETF). I am engaged in a short-selling campaign in this ETF. See previous posts here and here. I will pursue the strategy I have already disclosed. I am short two layers of DYY and will short a third layer if the H&S top is completed.

That’s all for now, folks.

Symbols related to this post: $ZW_F $DYY $NG_F $ZL_F $SI_F $SLV $CL_F $DJP $SIVR $GAZ $DBA $UNG

Disclaimer: I am a pure chartist. I do not trade based on fundamental or macro-economic factors.

###