…and other charts I am watching the week of September 12, 2011
One of the goals of this blog is to focus on the purity of price charts without the clutter of any number of indicators. Not a single chart in Schabacker’s manuscripts or in the Edwards and Magee book contains such indicators as RSI, stochastics, MACD, ADX, DMI, Bollinger Bands, oscillators, %R or the like. Yet, who can question the brilliance of their legacy?
All of these indicators are derivatives of price. I take nothing away from traders who make their living using indicators. All the more power to you! Heck, some of my good trader friends use various indicators. But, in my mind, why should I study price derivatives when I can directly study price itself? Am I discouraging novice traders to avoid the use of indicators? No, not at all! But for me, price is king.
The markets and charts I am watching the week of September 12, 2011 include:
- Silver
- S&Ps
- Nasdaq 100
- Soybean Meal
- Soybeans
- Euro Currency (EURUSD)
- Canadian Dollar
- U.S. Dollar Index
- Crude Oil
- Rough Rice
- Sugar
It is highly unlikely that I will become involved in any markets besides these. I select my trading list each Saturday for the following week and I attempt to keep the list intact without additions.
So, here we go, folks
Silver
Often times a market will become a cross dresser – putting on bearish clothing one moment and bullish clothing the next. Such is the present case in Silver. Both a bullish and bearish story can be told technically. The bullish pattern is a bull horn, or sloping bottom (solid lines). Note that the final breakout of the horn has stalled in the form of a symmetrical triangle. A move into new highs would complete this triangle and confirm the horn – and establish a target of 52.00.

The bearish narrative is a rising wedge from the June low (dashed line). The same small 4-week triangle is also in play in the bearish scenario. A completion of this triangle in a downward direction should provide the thrust to complete the wedge, establishing a target of 32.50.
I am without a position in this market, but I have the market bracketed with buy stops above and bear stops below.
S&Ps
Like all other of the broad stock indexes, the S&Ps are forming a 5-week flag. I continue to view the H&S top completed in early August as a MAJOR reversal in stocks.

I am short two layers. I will attempt to extend leverage next week on any minor rally. I believe that Friday will become to the upcoming decline what August 1 was to the early August decline. I have given up (for the moment) on the idea of a BOGI gap. Instead, I am labeling the flag as the BOGI flag. I will extend leverage further upon the completion of the BOGI flag.
Nasdaq 100
The Nasdaq is forming a flag as a retest of its massive broadening top. The broadening top is a rare, but potentially powerful chart pattern. According to Schabacker, “In most cases a rally will develop shortly after the level of the fourth reversal has been broken, and in most cases this rally will carry prices about half way back….” The retests of broadening tops are notorious for digging back into the completed pattern.

In fact, the retest rally in the Nasdaq retraced 55% of its July to August decline. I believe this flag will resolve itself in the direction of the broadening top with a flag target of 1899, slightly lower than the target from the broadening top.
I am short one layer, looking to extend short leverage. I think that Friday will be the counterpart to the upcoming decline as July 27 was to the first major leg down.
Soybean Meal
A firm retest of the underlying rectangle took place this last week. The market seems to lack any ability to rally. We will see if this retest holds. A move below the August 22 low negates the rectangle. I am fully committed to the long side. I do not have a very good feeling about this trade, but I am not willing to trump my trading rules to satisfy my feelings.

Soybeans
The daily Soybean chart is almost identical to the Meal chart. A break below last week’s low will begin to put the bull trend in Soybeans into doubt. I will buy a retest of this past week’s low with very tight protective stops.

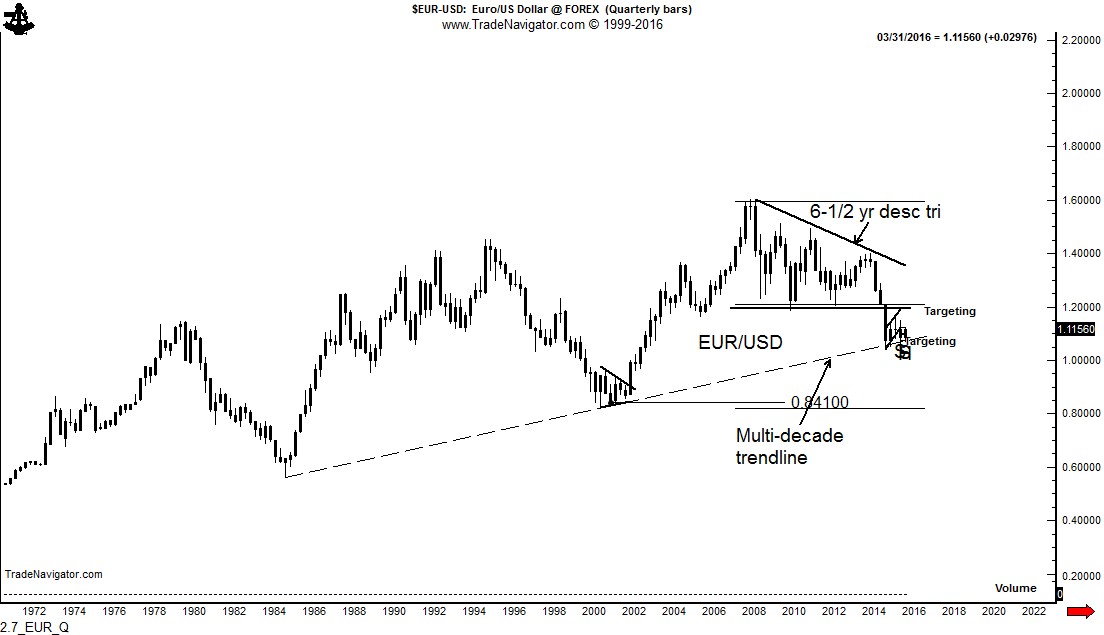
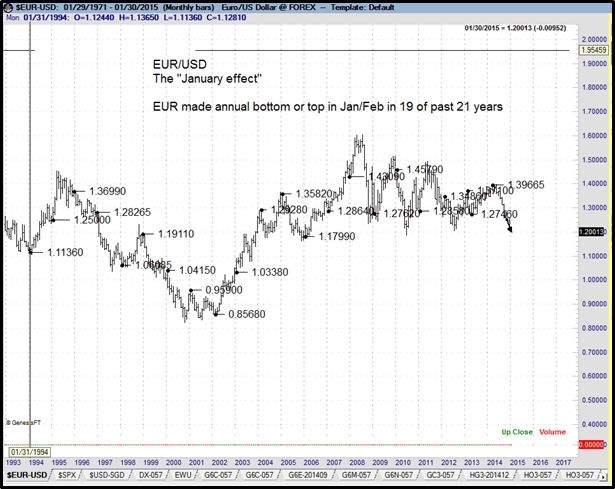
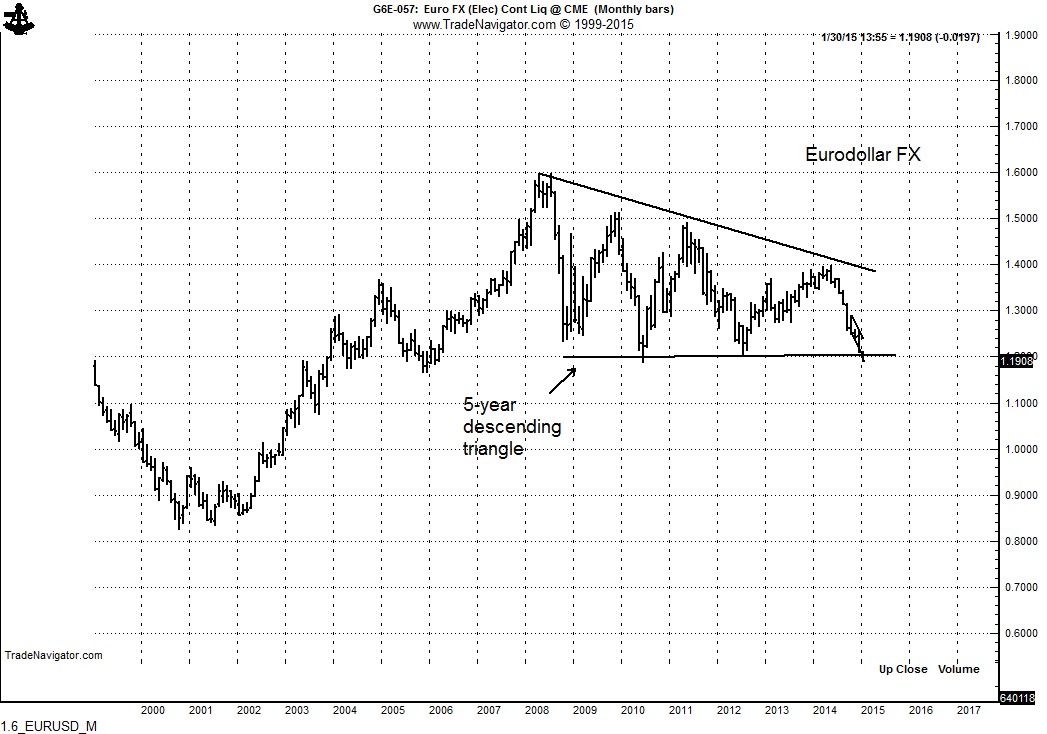
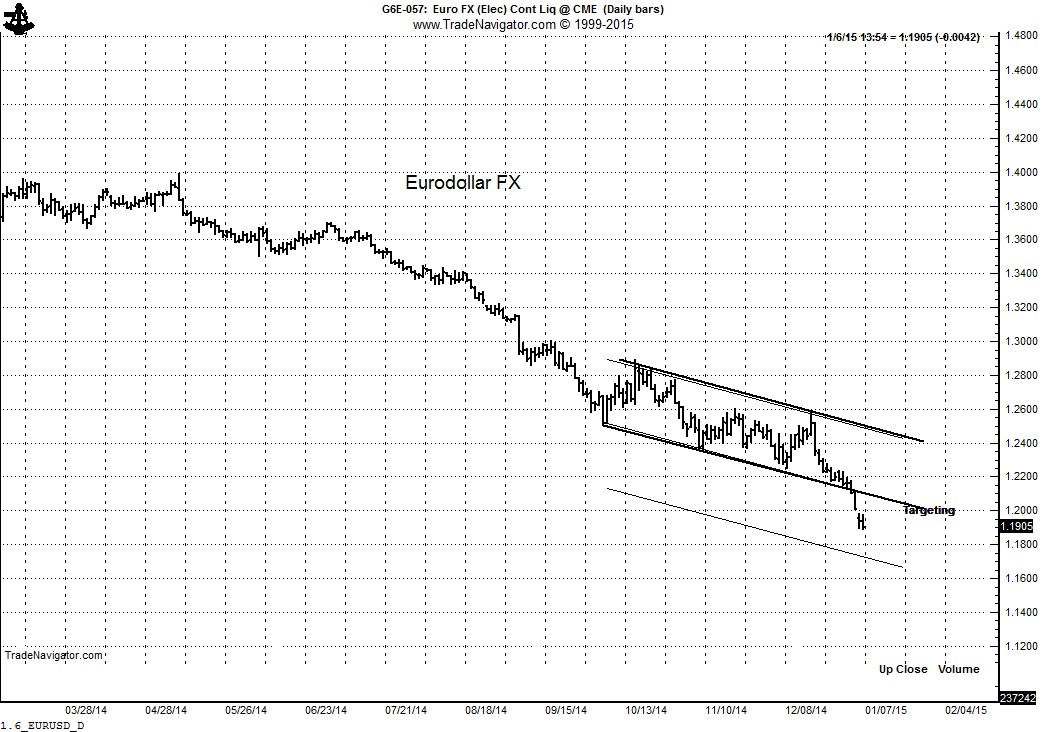
Euro Currency (EURUSD)
The decline this past week resolved all of the confusion of the past 4 to 5 months on the daily chart by completing a decisive descending triangle. To label this price action as a descending triangle I am ignoring the one-day spike down in July. It was an event Edwards and Magee define as an out-of-line movement. The descending triangle has a target of the test of the January low in the area of 1.2900. I am short one layer.

Canadian Dollar
Two charts are shown. The upper chart is the weekly CME futures contract. This chart displays a possible double or “M” top, requiring a close below par (1.0000) for completion. The lower chart is the daily graph of the spot USDCAD which trades at a reciprocal value to the futures. Thus, the spot chart shows a possible bottom pattern, requiring a close above 1.0000. I will wait for the completion of this pattern before taking a position.


U.S. Dollar Index
The market completed a rare triple bottom on Friday. This bottom is almost identical to the DX bottom in 2008 (not shown). The target of this pattern is 81.50. I am long one layer.

Crude Oil
The Crude Oil is setting up for another leg down in a bear market that began in May. As shown on the weekly chart, there is plenty of empty air underneath the market.

The daily chart displays a 5-week rising wedge. Normally this is not a long enough pattern for me to trade, but given the strong downtrend I will short this market if the wedge is completed. The CFTC COT data shows that the commercials continue to be significant sellers of futures. Notice how volume has dried up during all sideways periods. This volume profile confirms the major bear trend.

Rough Rice
The market has now confirmed the completion of the 7-week inverted continuation H&S on the daily chart (top graph), which in turn, confirms the 5-month triangle on the daily graph, which in turn confirms the massive 5-month H&S bottom on the weekly chart (bottom graph). The target is 2280. I am long one layer.


Sugar
I want to once again show the quarterly chart. The massive base completed in 2009 is the dominant pattern driving this market. This base has an eventual target of 60 to 70 cents – and this has biased my interpretation of the daily charts for the past two years.

The daily chart (March) is forming a possible 2-month continuation H&S pattern. I have bought this market in anticipation of a right shoulder low. I am not sure this will prove to be a successful trade, but the reward to risk ratio is quite favorable with this maneuver. If the market can hold last week’s low I will attempt to quickly build leverage. The Sugar ETF, SGG, is also shown.


I am basically willing to bet that this current area of consolidation will lead to another leg of this bull trend. If my foundational bias is incorrect I will almost surely be wrong on the majority of my trades in the months to come.
Markets: $QQQ, $NQ_F, $SPY, $ES_F, $ZM_F, ZS_F, $SB_F, $SGG, $USDCAD, $G6C_F, $FXC, $ZR_F, $EURUSD, $G6E_F, $FXE, $DX_F, $UDN, $UUP, $CL_F, $OIL, $$
###