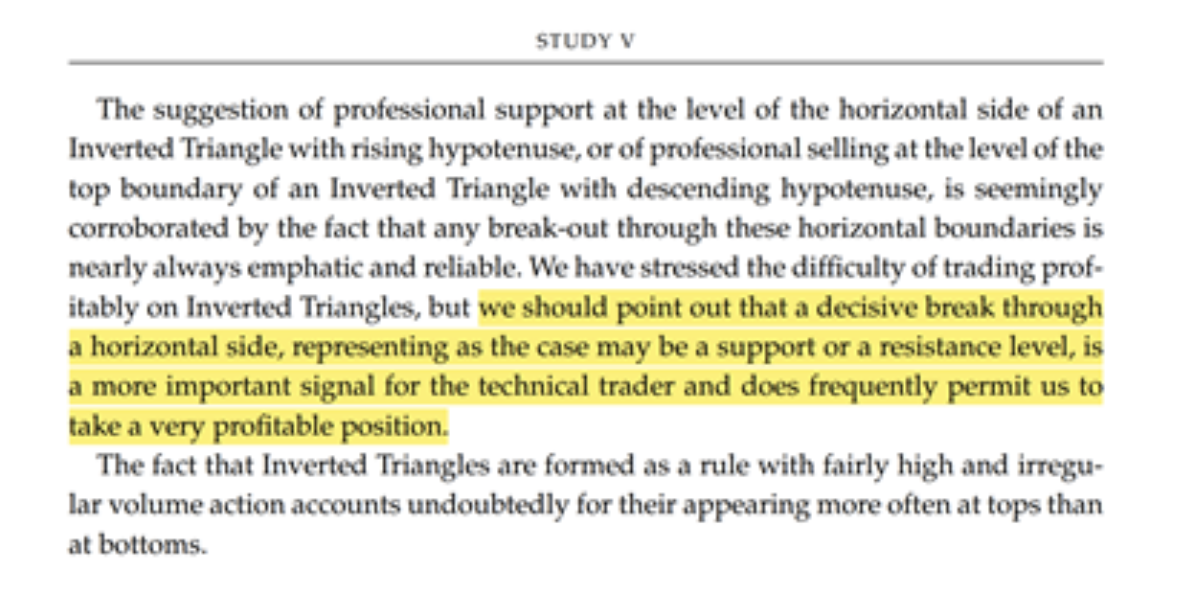
Weekly Chart Patterns – Posted Aug 2021

Are all weekly charts created equal?

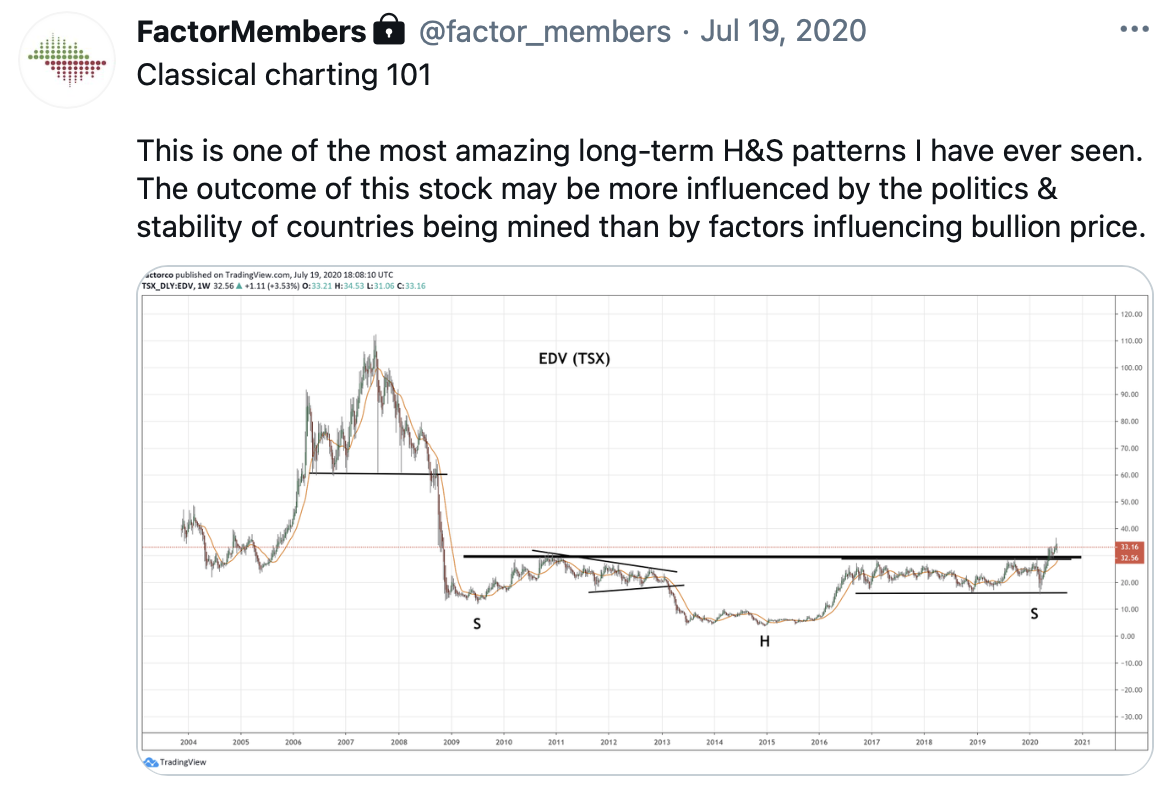
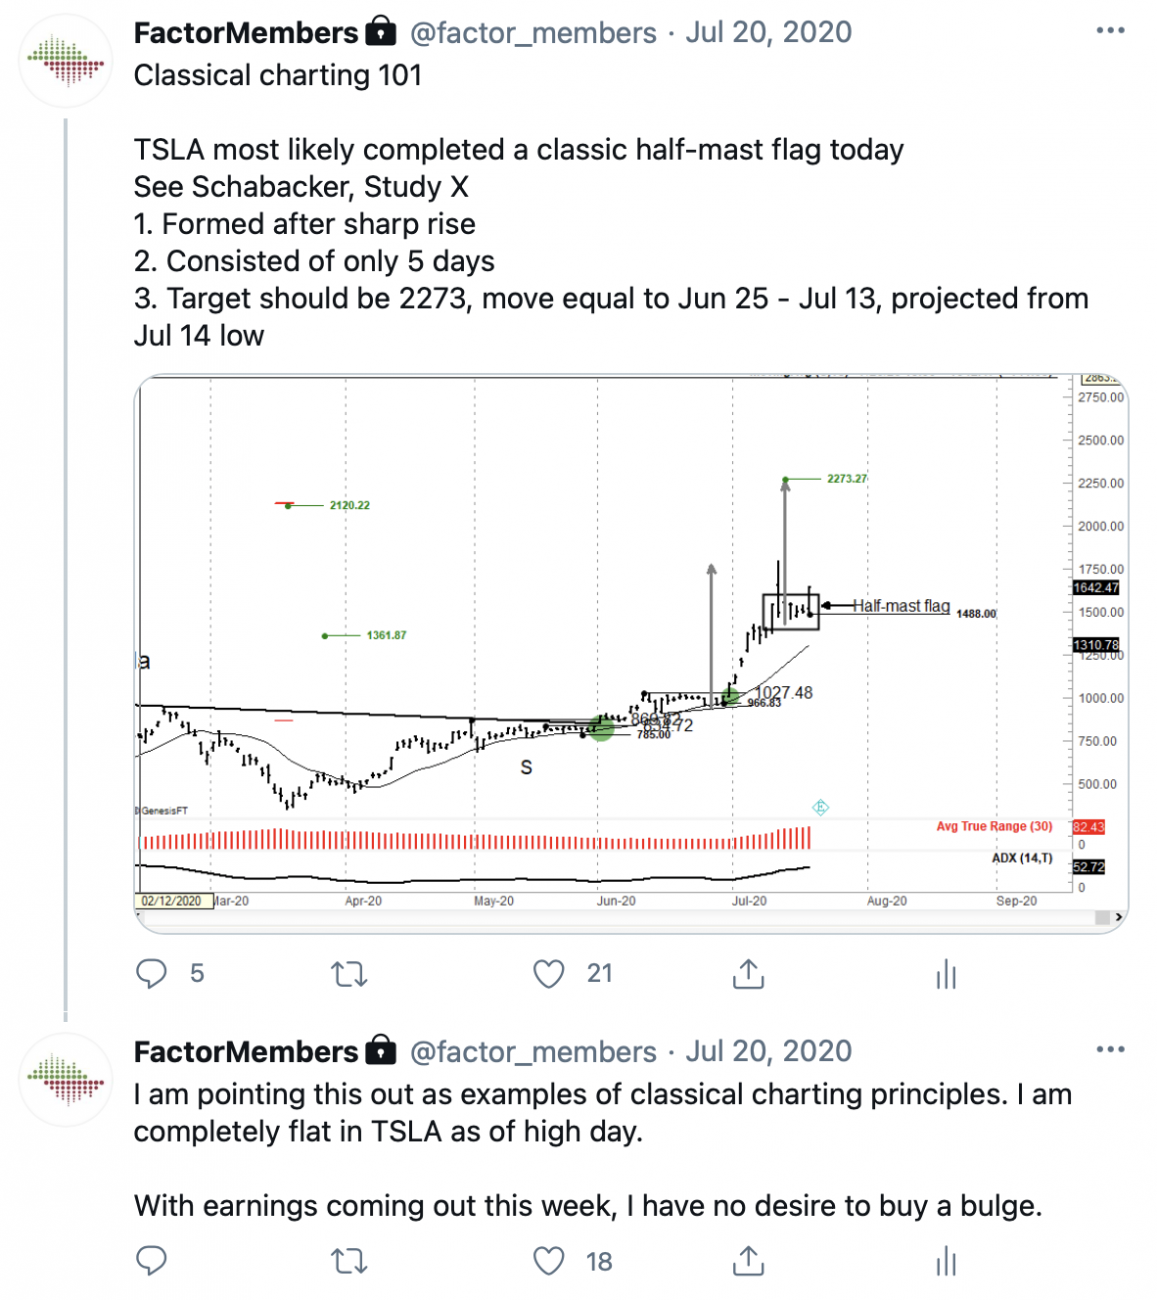
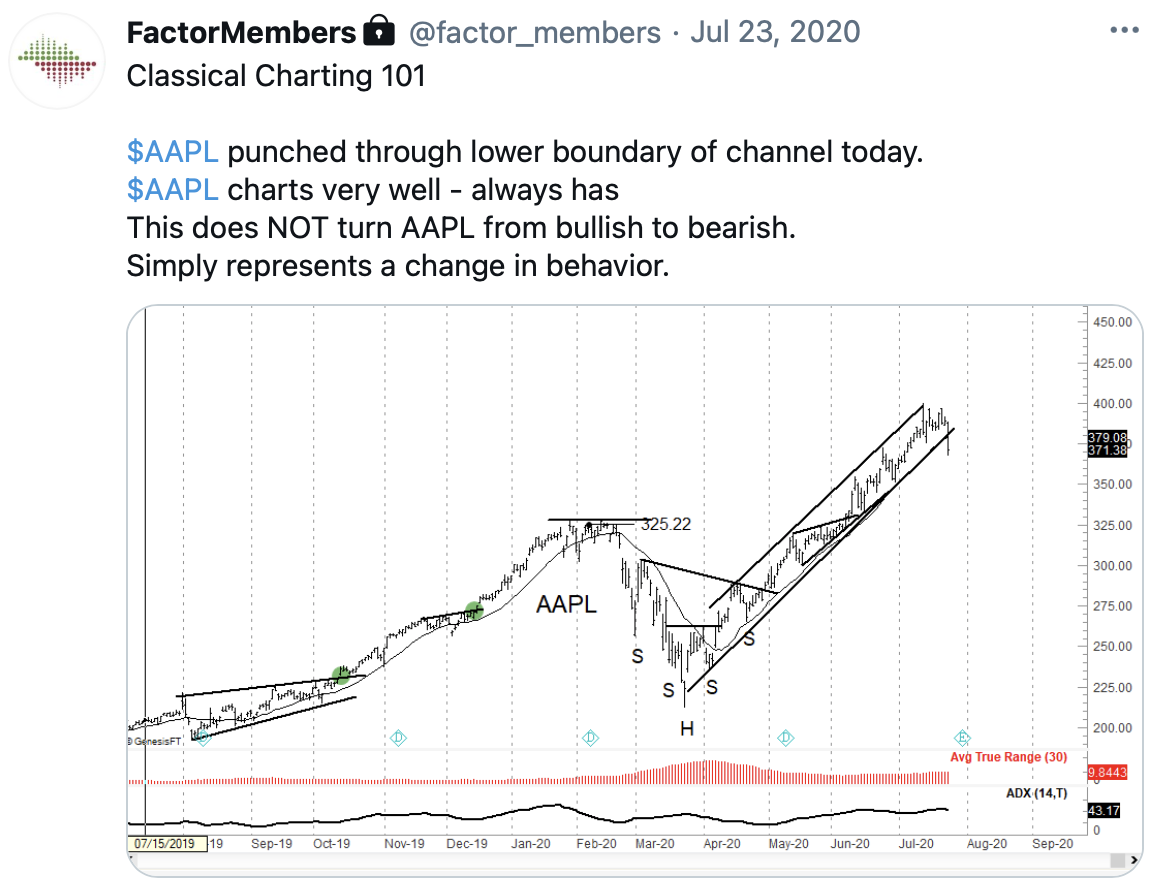
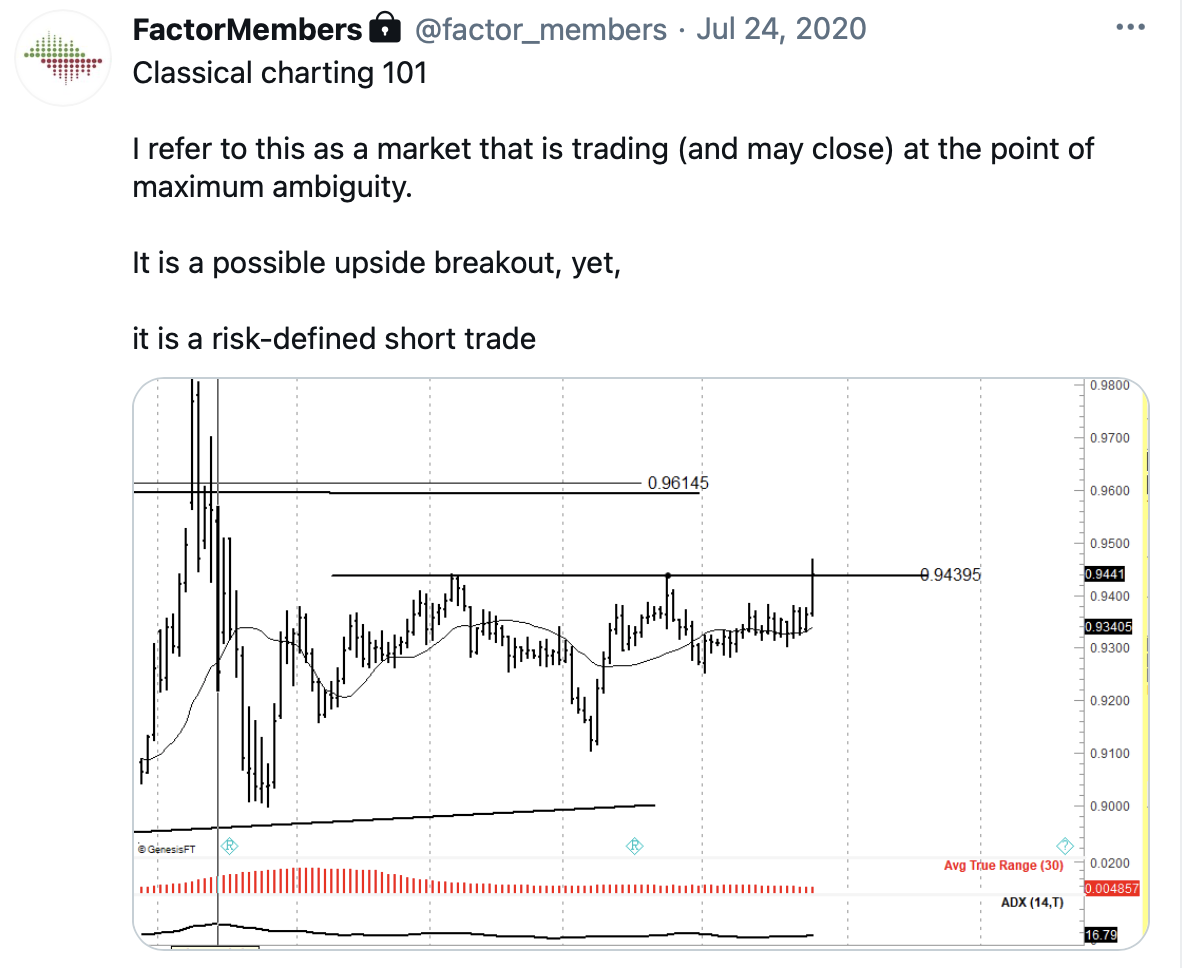
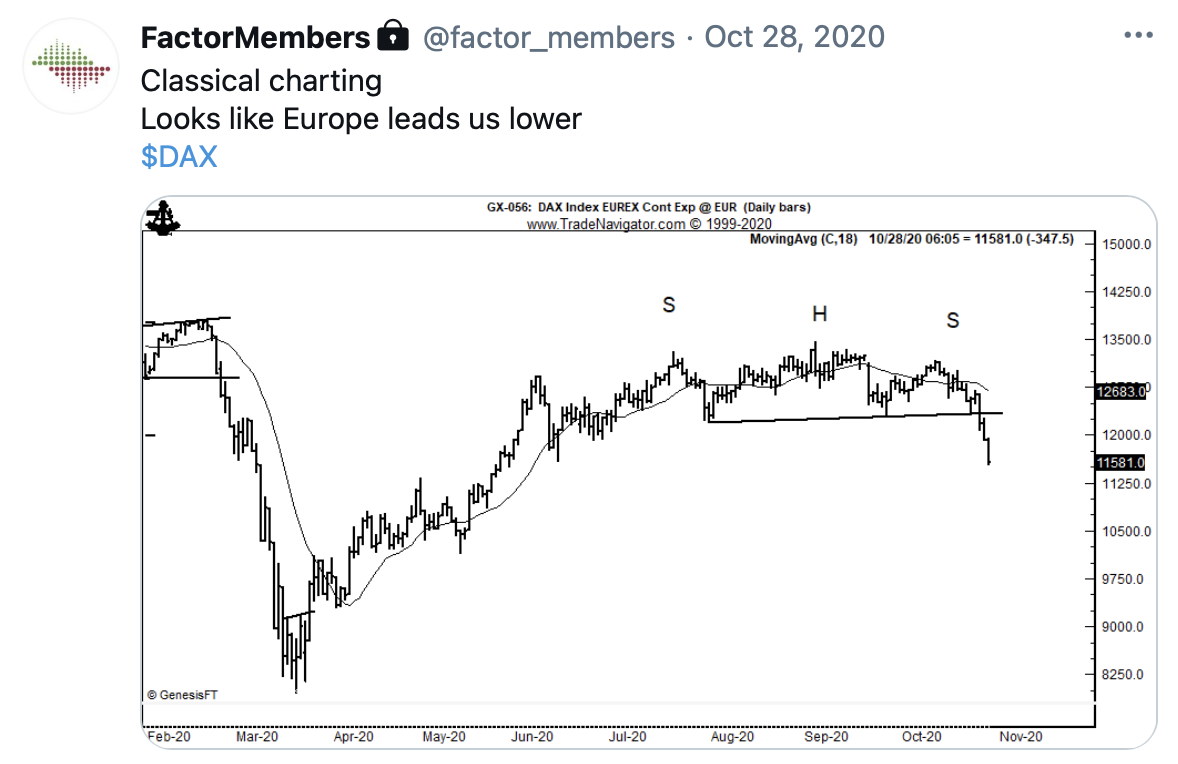
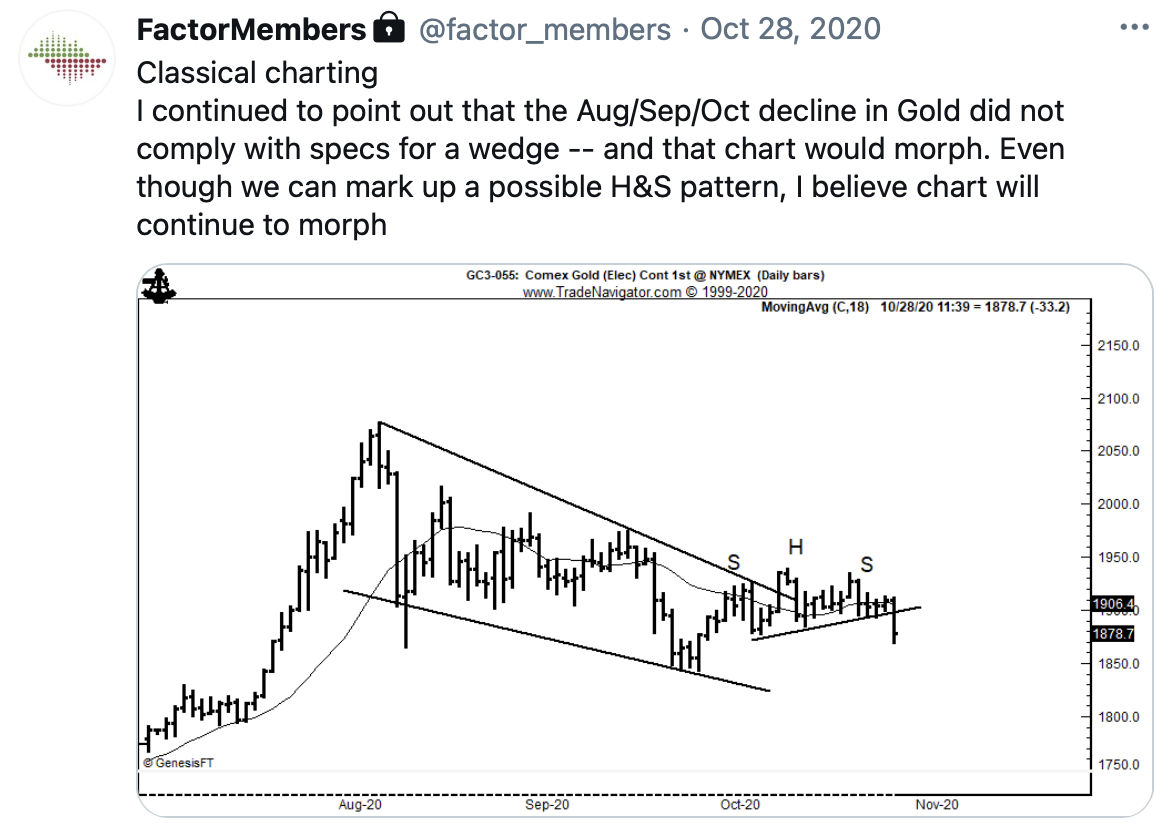
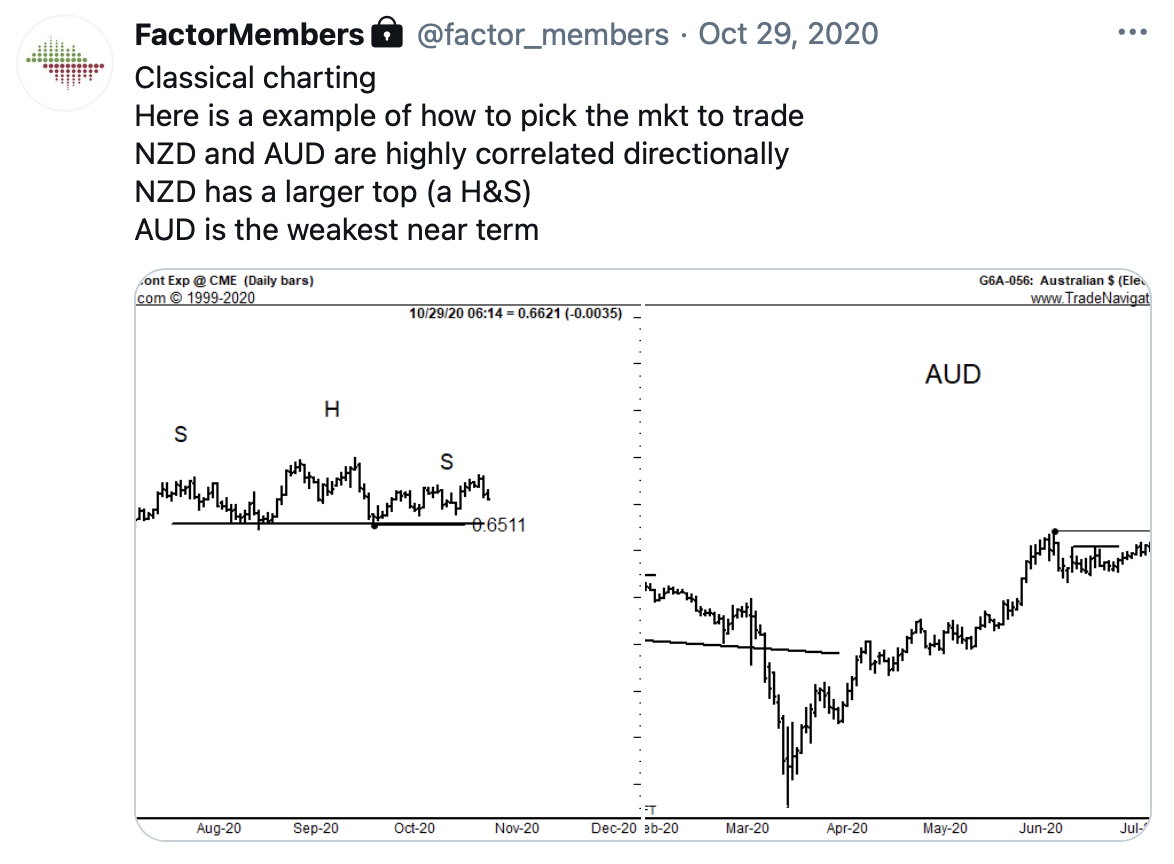
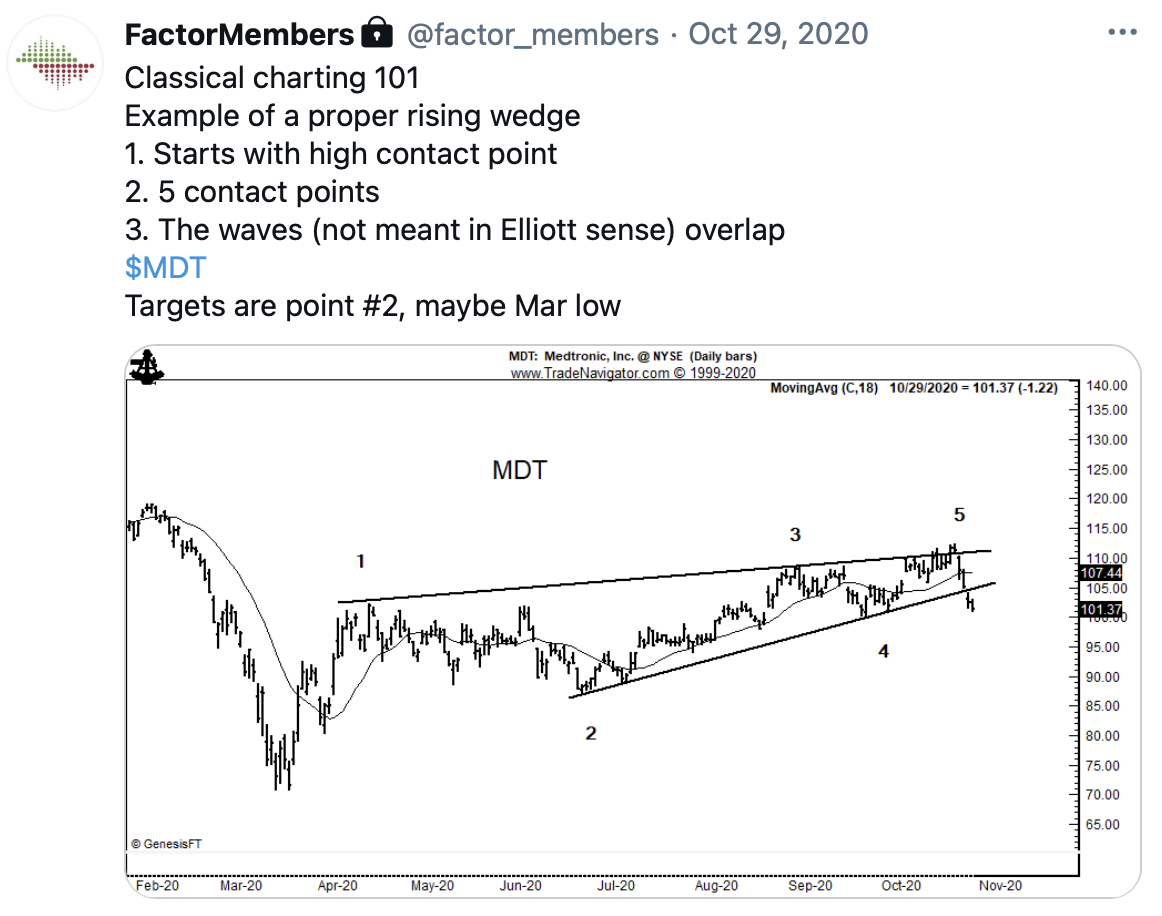
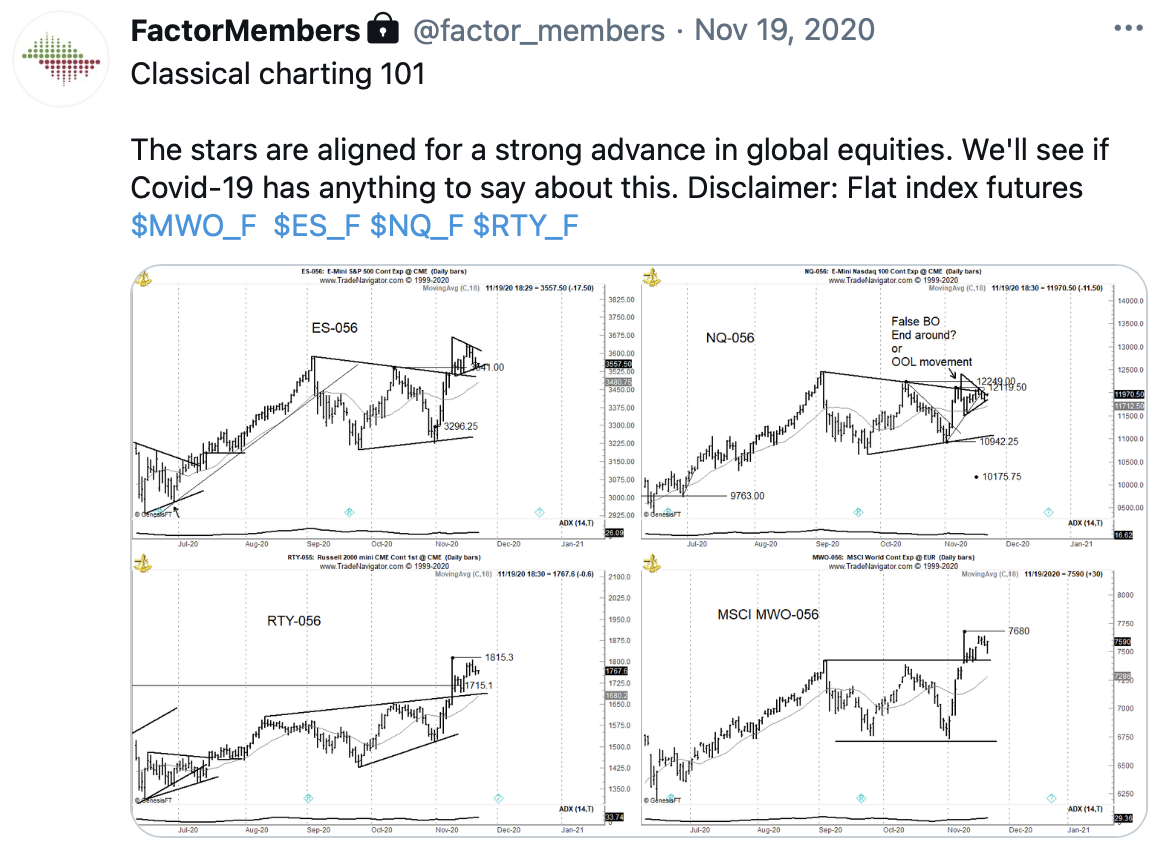
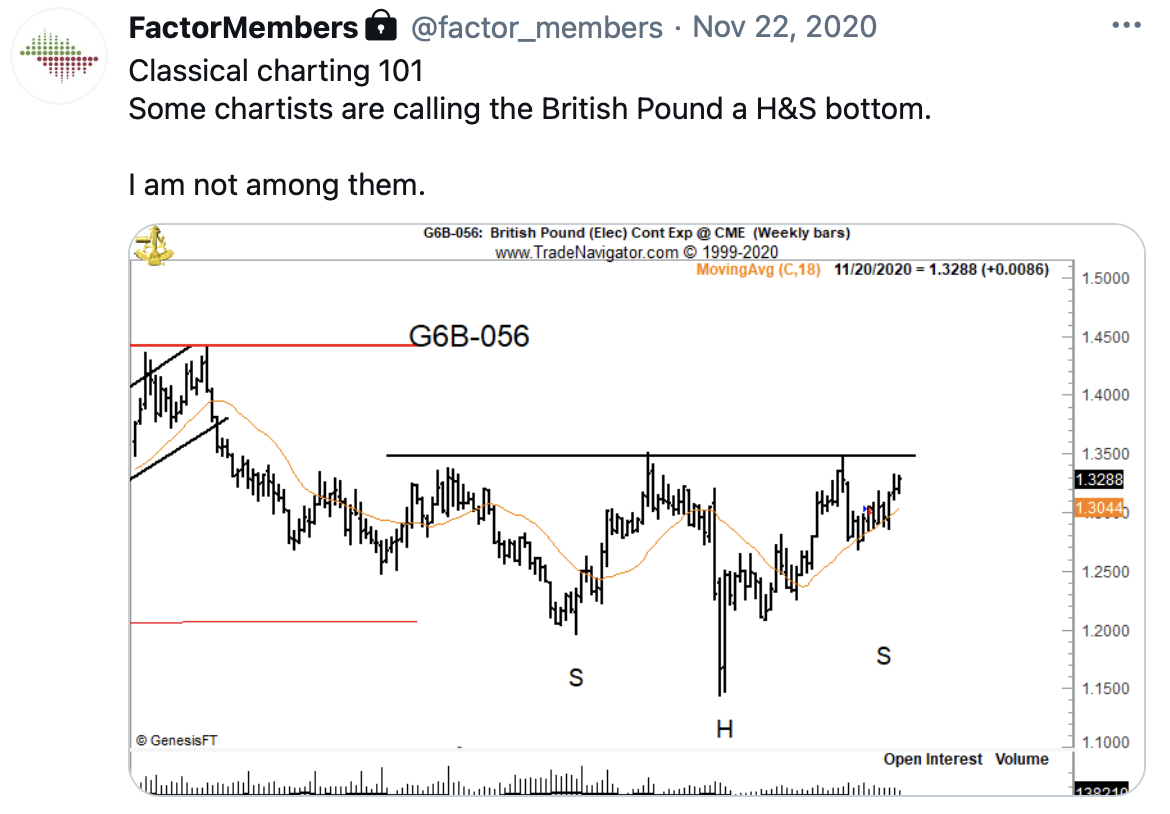
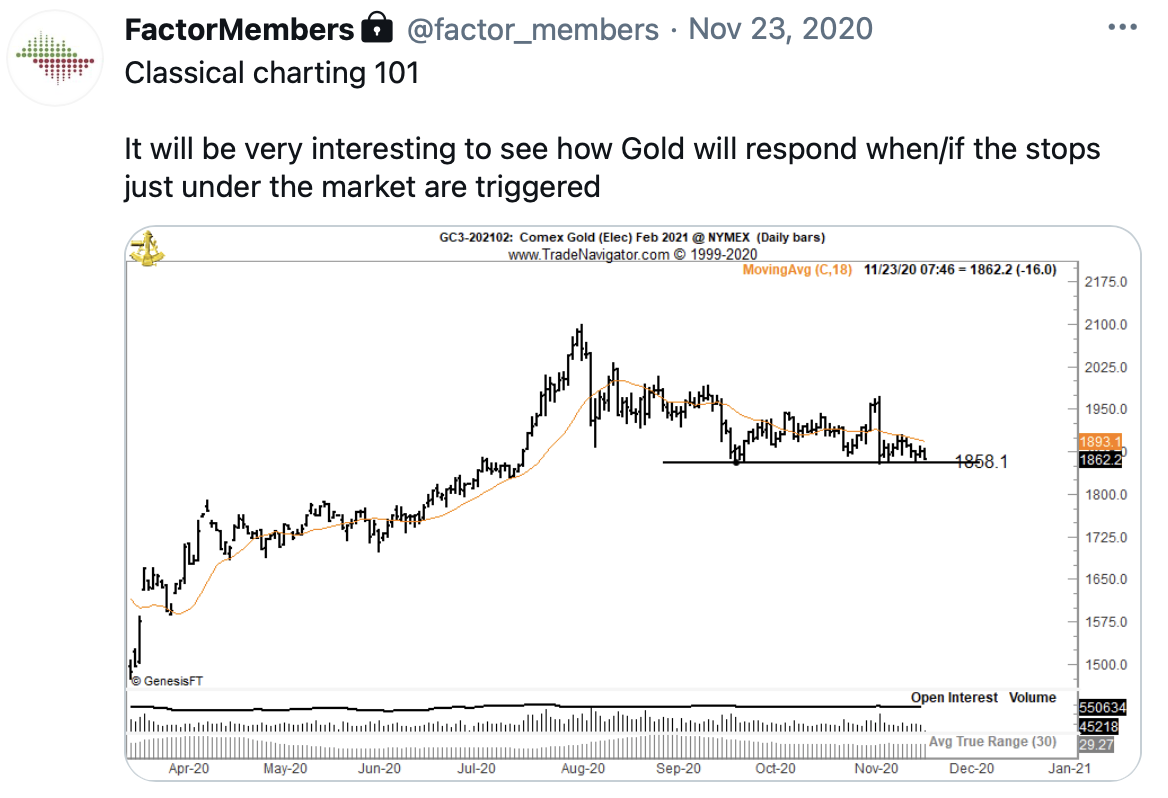
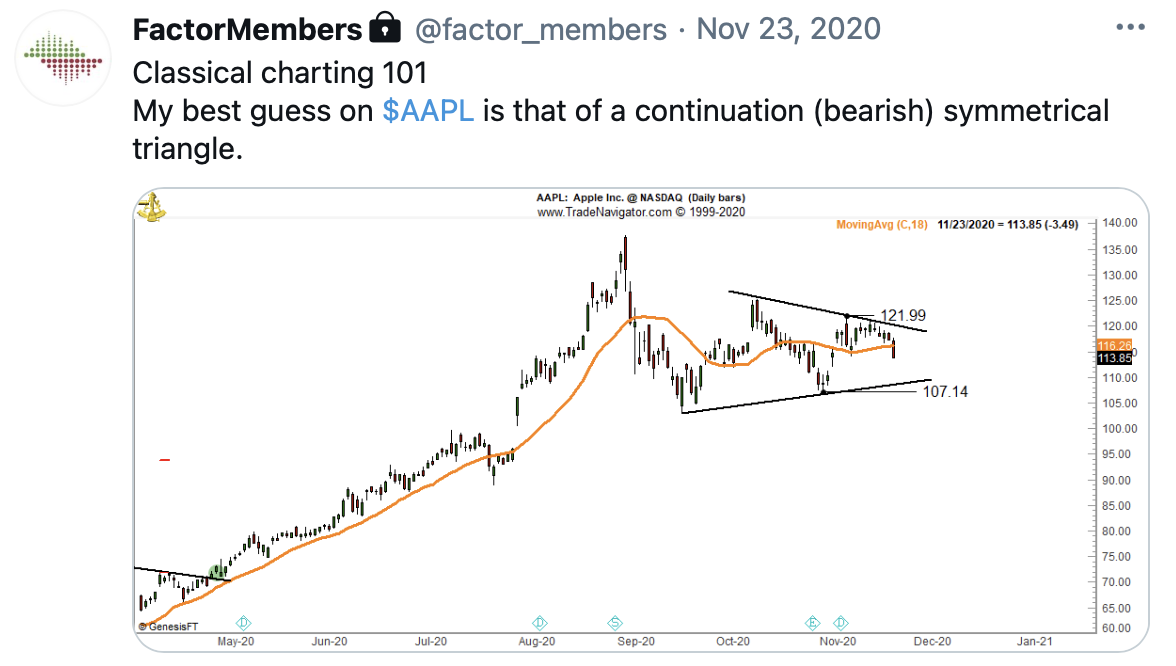
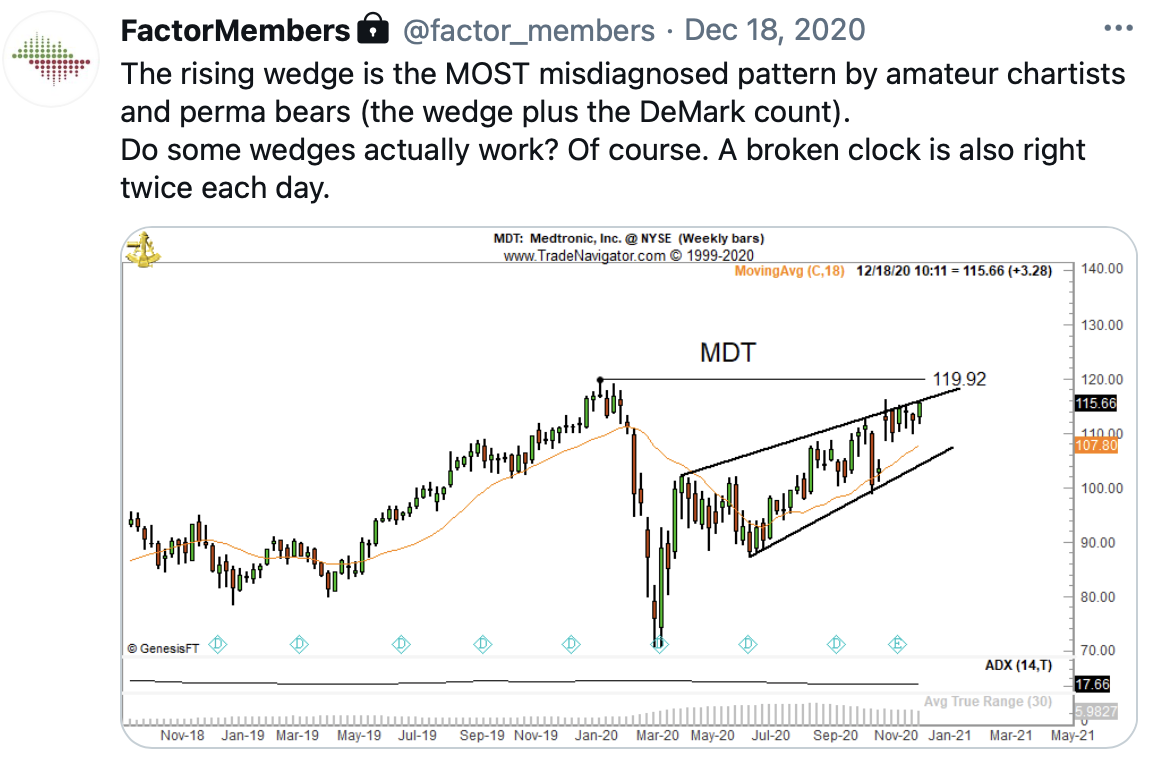
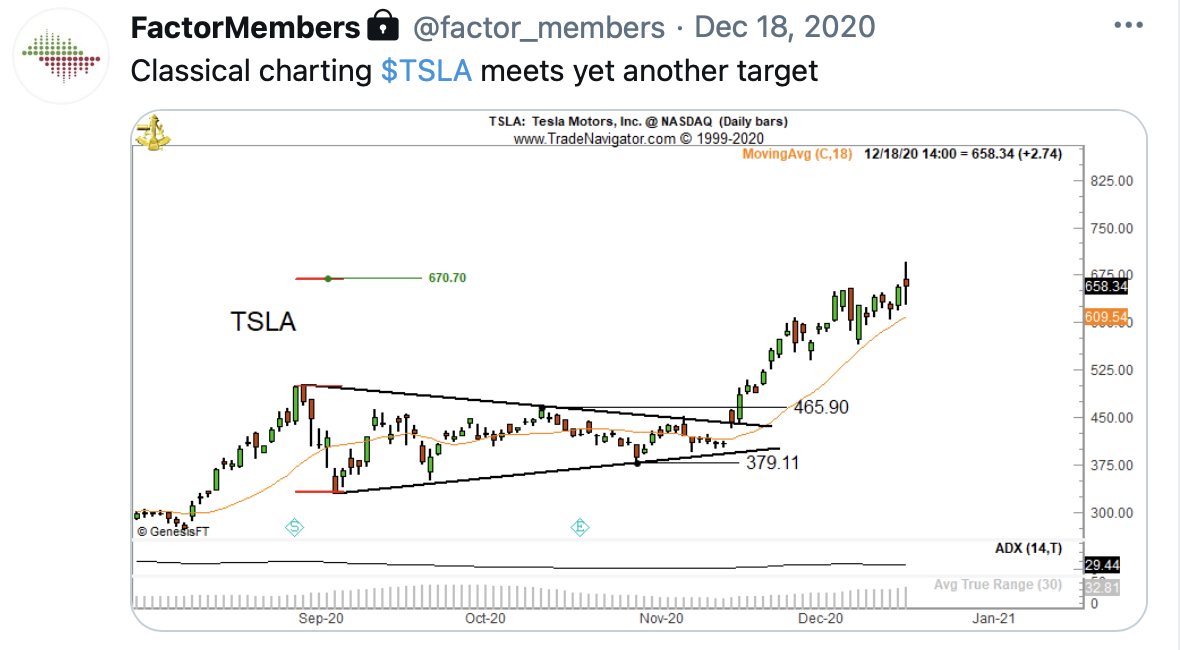
As a general rule weekly chart patterns are more reliable than are daily chart patterns.
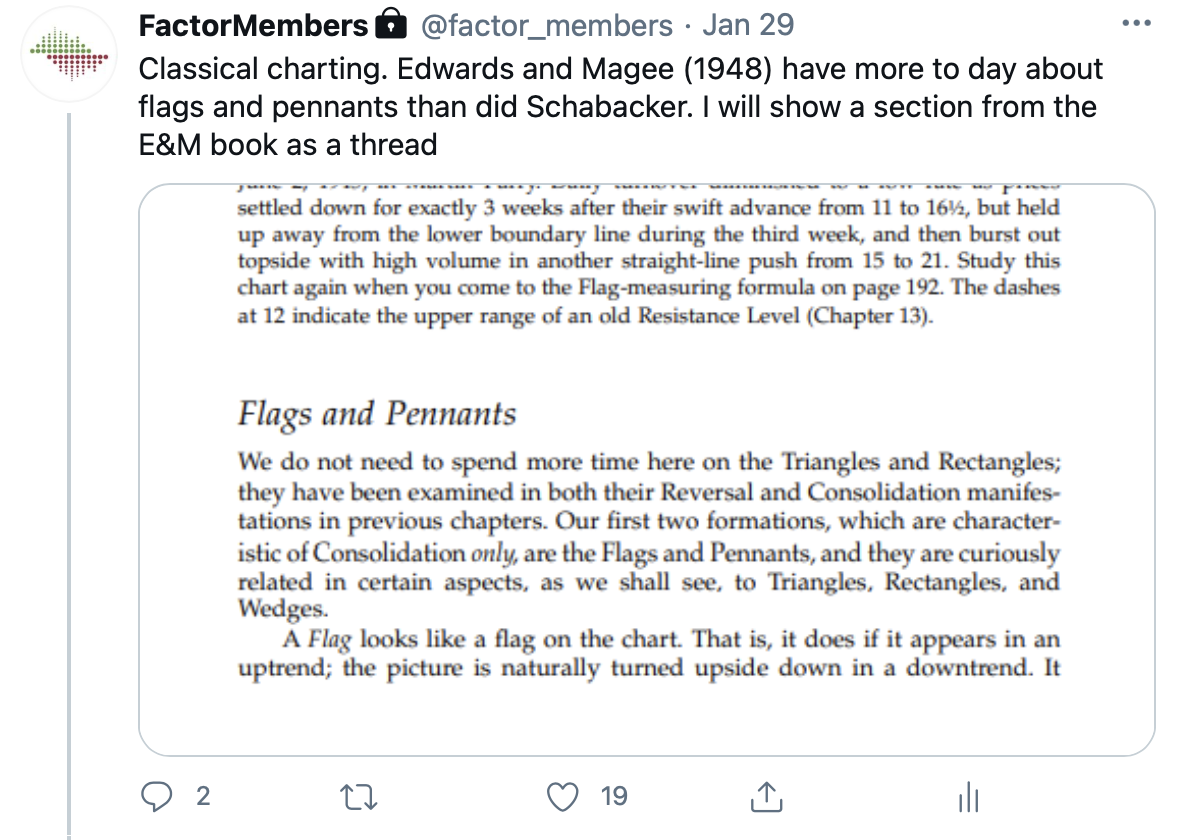
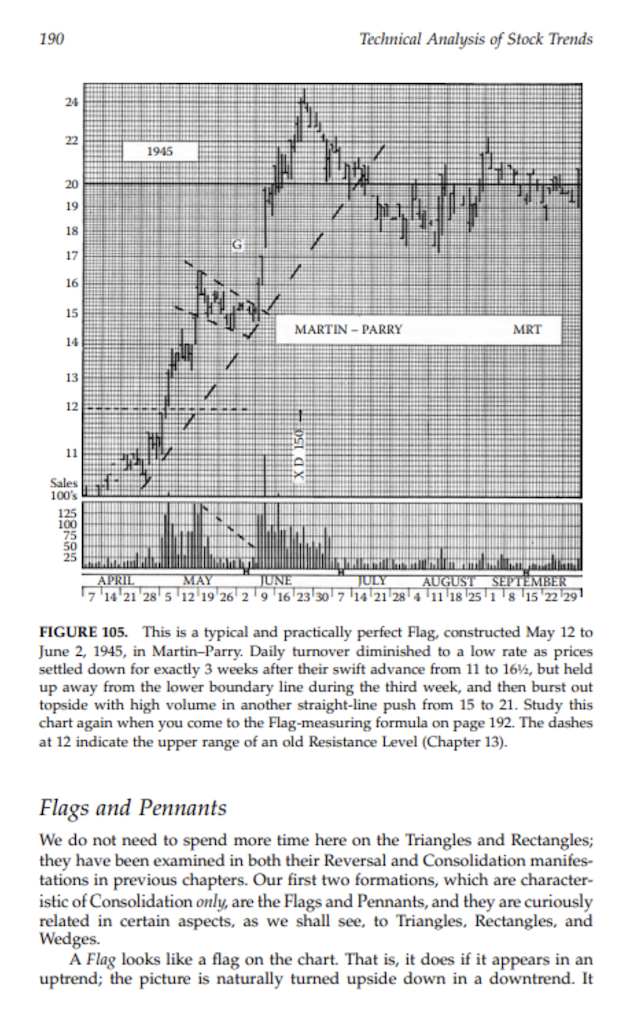
Weekly chart patterns are of several varieties. The main varieties are Mega Patterns, Minor Patterns and Hybrid Patterns.

The Head and Shoulders Pattern

Factor Report Special Paper, March 7, 2021, The Head and Shoulders Pattern

The Head and Shoulder Pattern. Properly identifying the continuation inverted H&S pattern (and other H&S construction).

The Hierarchy of Chart Reliability

Factor Update, July 6, 2019

Richard W. Schabacker

To a lot of people who are global macro, or take a traditional approach to markets, when they hear the word charting, they think voodoo. The reality is that classical charting princi- ples were formulated in 1933 by Richard W. Schabacker (a devotee of Charles Dow), who was the editor of Fortune Magazine. He made the observation that prices, when plotted on a chart, tend to reflect when a market is going through a period of accumulation by strong hands, or distribution by strong hands. What one is seeing in the chart is not directly what one perceives as important fundamentals, but rather a study of the supply and demand factors of the asset itself.

That was the premise upon which Schabacker wrote his book—that a lot can be said about a market based on the chart itself. That the chart was a study of the supply and demand of shares, not necessarily the fundamentals of an industry, or a business, or the overall econ- omy. That’s really how classical charting got launched. Depending on the exact geometric dimensions of chart construction, one could at least make better than 50/50 predictions upon what might happen in the future.

That was the origination of charts. In effect, the fundamentals that are really important are often reflected in the chart itself. The fundamentals of the economy, and trade wars, and government debts, and supply and demand within an industry—a lot of that ends up being reflected in the chart itself, if one becomes astute at trying to ascertain what the chart is telling you.

I do not believe that charts predict price. There are many technicians who would say that. I’m not in that camp. What I do know is that charts tell me three things. First, they tell me the trend of the market. Where has the market been?

Second, they tell me whether a given stock or commodity is presently in a period of conges- tion, or in an active trend. Lastly and more importantly, as one becomes a little more sophisticated with chart techniques, charts can say an awful lot about a trade that might present an asymmetrical reward to risk ratio.

Excerpt from PETER BRANDT CFA MAGAZINE interview October 2018


RECOMMENDED BOOK

(Factor is an Amazon Affiliate, we do receive a small commission if you purchase via this link.)

What is a decisive breakout?

I often use the phrase “decisive breakout.” So, what is a “decisive breakout” is a question I am often asked. In equity markets a breakout is a move 2% through an important chart point within the pattern under review. In the case of a H&S pattern the chart point I most often use the right shoulder low or high as the criteria for the 2% breakout. [Edwards and Magee use a 3% standard.] Defining a “decisive breakout” is not as easy in the case of futures or forex markets, at least for tactical execution. For example, a 2% breakout in Gold (at the present price) would be $24, or $2,400 per futures contract. A 2% breakout in T-Bonds would equal 77/32nds. In futures I interpret a breakout much more subjectively and significantly more narrowly than I do in equity markets. For example, in a tight and well-defined horizontal pattern in T- Bonds a breakout might equal as little as 8/32nds. In S&P futures I attempt to define a breakout of a tight and well- defined horizontal pattern to as little as six points. [Remember that I am a swing trader who uses extremely tight risk protection.]

Factor Update, December 15, 2018

Classical Charting 101

This document is intended to provide novice traders with a brief introduction to classical charting principles and to explain my specific approach to market speculation. Classical charting is a specific sub-set of technical analysis as opposed to fundamental market analysis.


Examples from our Private Member Twitter page

Continuation vs. Continuous Futures Charting

The Apr 16, 2017 Factor Update addressed a member’s question on the use of Continuation vs. Continuous futures charting. I came down hard in favor of Continuation charts and against Continuous charts (in hindsight I was actually too harsh toward Continuous graphs).  My good friend and peer Jack Schwager posted a piece on LinkedIn taking the other side of the debate.

Volume as an Important Indicator

Early in my career I studied the works of Richard Wyckoff. Wyckoff considered volume to be an important factor in technical analysis, more so in equities than in futures for a reason I will not get into.  While I do not apply Wyckoff’s methods in any organized manner, there is one lesson from Wyckoff that I try to remember.

Compound Fulcrums

The compound fulcrum is an extremely rare pattern. In fact, if a chartist diagnoses this pattern more than once every few years, then it is being over-diagnosed.

Philosophy of Charting

Some of you — maybe many of you — may find the discussion to follow quite boring or think it arbitrary and irrelevant. Think again! Successful market speculation is all about critical thinking and challenging conventional wisdom. If your hard-earned money is on the line in the stock, futures or forex markets and you are not willing to think critically and deeply about issues facing traders, then your fate is already sealed.