Charts of the day – August 14, 2013 (Hogs, Cotton)


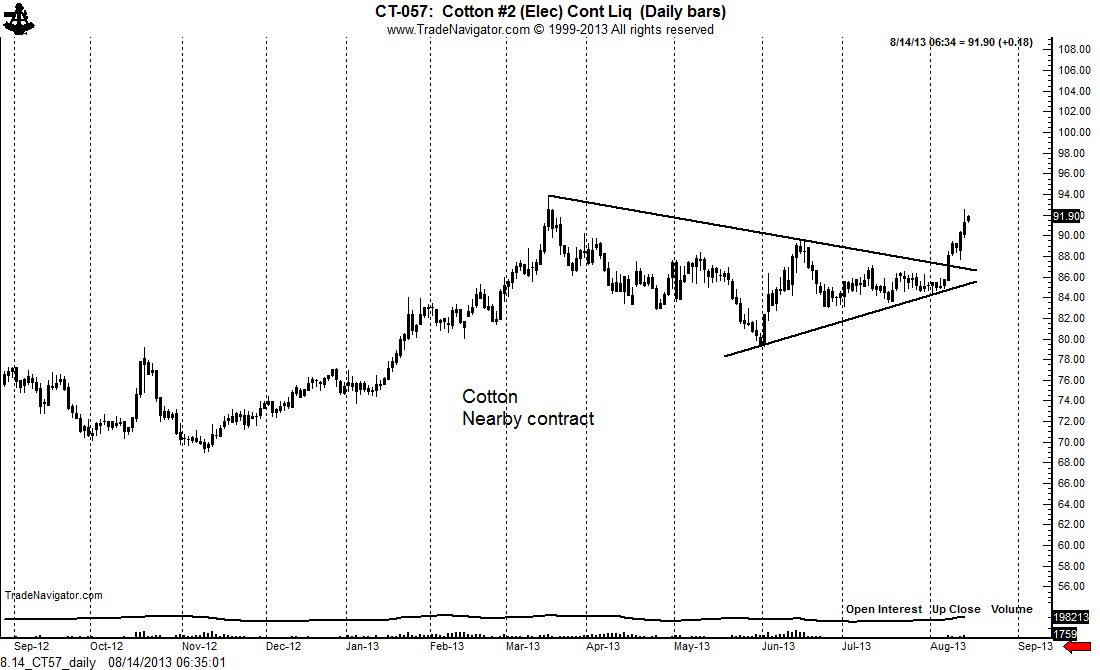
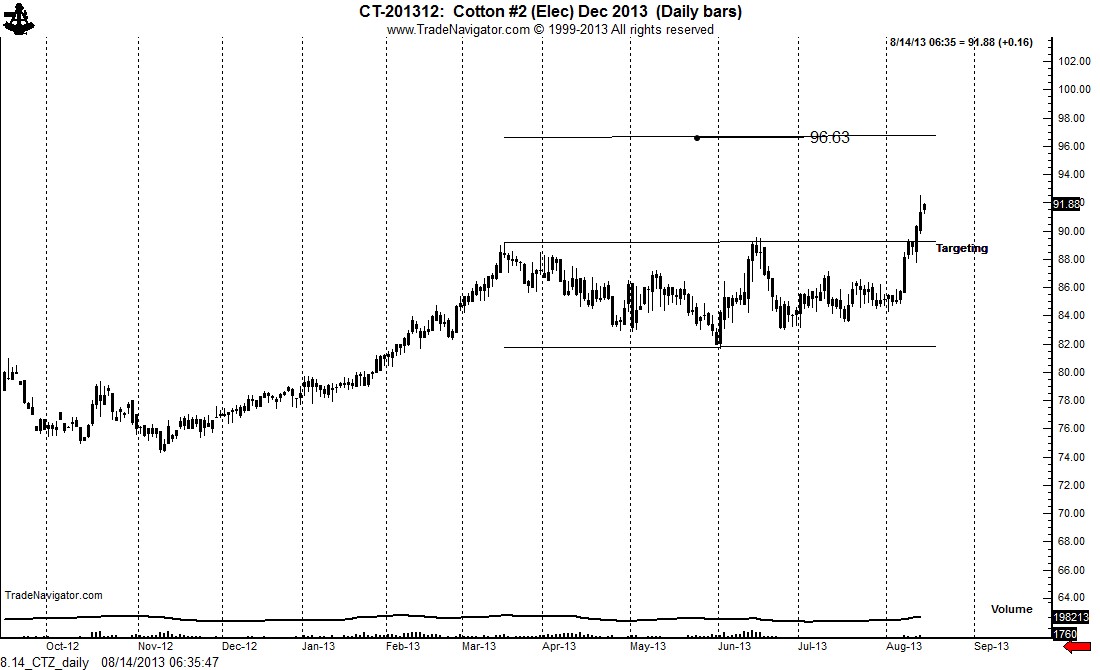
The nearby continuation chart in Cotton completed a 4+ month continuation triangle on August 7. The December contract completed a continuaition congestion on August 12, confirmed on August 13. Many traders fear buying a market that has already broken out — instead, they often get chopped up within a trading range attempting to get positioned before the breakout, then they miss the move when it happpens. Any period of weakness in a strong advancing trend is a buying opportunity.

8.14_CT57_daily

8.14_CTZ_daily


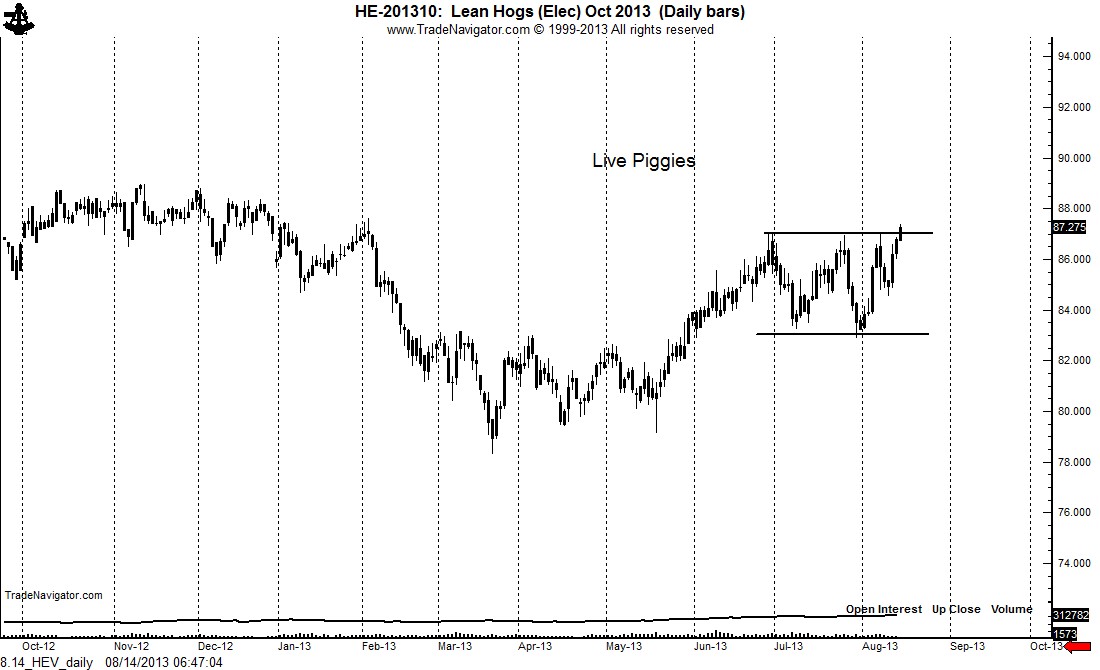
The October Live Hog chart is attempting today to complete a 7-week rectangle. A strong close today would complete this pattern and serve as a buy signal. However, the failure of the market to breakout convincingly would be a cause for concern for long position holders.

8.14_HEV_daily

$HE_F, $CT_F

###

Apple and a history of head and shoulder patterns


The H&S pattern has served an important role in the turning points of $AAPL in recent years

The H&S pattern — when properly identified — is the most reliable of all classical chart patterns. Unfortunately novice market analysts are way to quick to mislabel market action as a H&S configuration.

The H&S pattern has served as the key turning point in $AAPL since the March 2009 low. The first chart below shows the classic H&S bottom completed in March 2009. This pattern launched a $600 rally.

8.13_AAPL_2009

The late 2012 top took the form of a small H&S top. It is not unusual for H&S tops to be brief, whereas H&S bottom patterns tend to be much longer in duration.

8.13_AAPL_Oct12

The rally in AAPL today confirmed a 6-month H&S bottom. It appears as though the long-term bull trend in AAPL has re-emerged. The intial target of this pattern is $545. A close below $425 would negate this interpretation.

8.13_AAPL


$AAPL


###

My opinion of current futures markets (as of August 7, 2013)

This content is for members only

Next leg of Euro Currency bull trend against the British Pound begins

This content is for members only

Massive triangle in Pound should lead to 1.3500

This content is for members only

Some hopefully final comments on Silver bulls

This content is for members only

Why I am a $65 bear in Crude Oil

This content is for members only

I am predicting $65 Crude Oil


Energy charts are a disaster waiting to happen

I have a crazy busy week ahead and am not sure I will have time for blogging. I am or may not be able to post more charts — I have many Icould show, Crude Oil, Brent, Gas, Heat. But I will show UGA charts (the ETF) for you stock folks. I have no time to elaborate, but do NOT be long energy — unless, of course, some silver bull gives you trading power of attorney.

6.22_UGA_daily


6.22_USG_weekly

$UGA

###

Is the Canadian Dollar about to get cross checked?

This content is for members only