

Cotton Chart
Cotton Chart
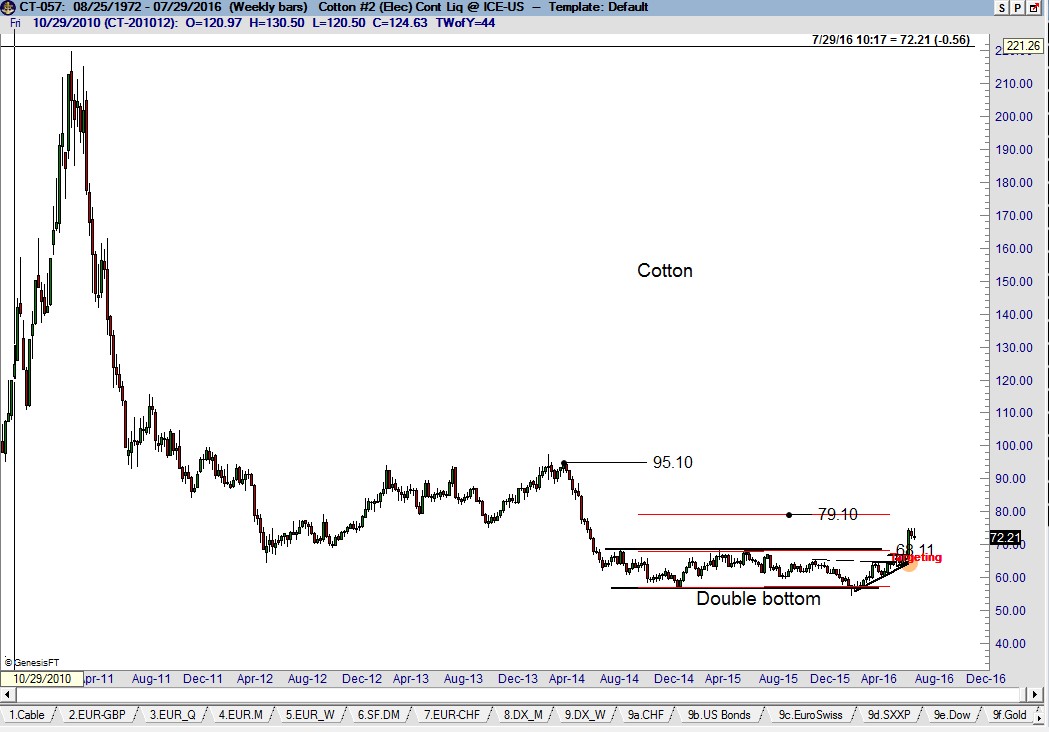
The dominant construction on the Cotton Chart continues to be the completed 24-month double bottom on the weekly Cotton Chart. The targets of this bottom are 79.10 (the measured move) and 95.10 (May 2014 high). The Dec contract was launched by a 5- week pennant. Factor is long, having taken partial profits.
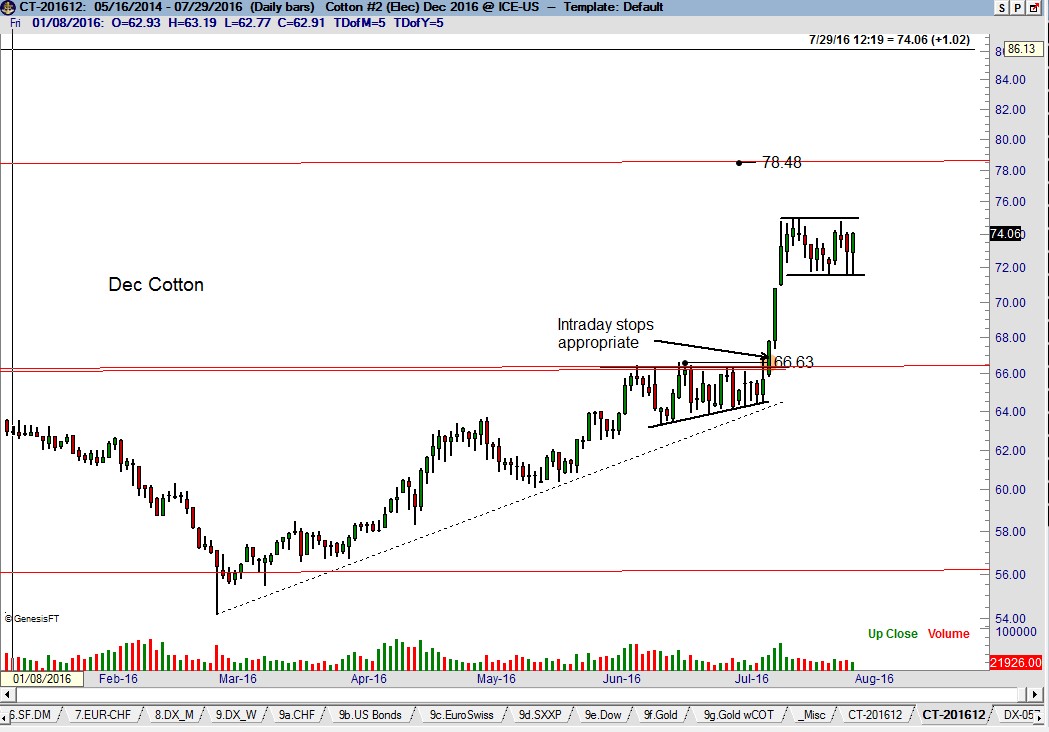
Cotton Chart – The market appears to be forming a small 2-week pennant – I am willing to increase my leverage based on this pattern. However, a longer period of congestion or even a sizable correction would be very normal given the magnitude of the Jul 11-13 advance. A decline back toward 71.00 to fill the Jul 13 gap cannot be ruled out. There is no reason at this time to believe the period since the Jul 13 high will become part of a topping pattern.
Factor Membership is available and you could consider your membership in the Factor Service as just one more trade. If the Factor Service is not of value to you, well, it is just one more trade that did not work. Through the Factor Service I endeavor to alert novice and aspiring traders to the many pitfalls you will face – and to offer advice on overcoming those pitfalls. My goal is to shoot straight on what trading is all about. For more information watch my 30 minute webinar where we cover the Factor service in depth.
I hope you will consider joining the Factor community.


