Tag Archive for: #DRAWDOWNS

The Dreaded “D” Word, August 2022

This content is for members only

Building Performance, One Trade at a Time, November 2019

This content is for members only

Building Performance, One Trade at a Time, November 2019

This content is for members only

Factor Update, July 26, 2019

This content is for members only

Trading Commentary – 2013 re-lived

This content is for members only

Factor Update, February 26, 2017

This content is for members only
trading drawdown - peter brandt - factor trading

Trading Drawdowns

Most Long-Term Profitable Traders are Under Water Most of the Time – (Trading Drawdowns)

The dream of novice market speculators is that they will continually bask in the warmth of profitable times. This myth is falsely promised by the promoters of trading systems and trading training programs. In fact, just the opposite is true. Most long-term profitable traders spend the vast majority of their trading careers either in Trading Drawdowns or recovering from a drawdown. Any slick promoter who tells you different is not dealing from a full deck.

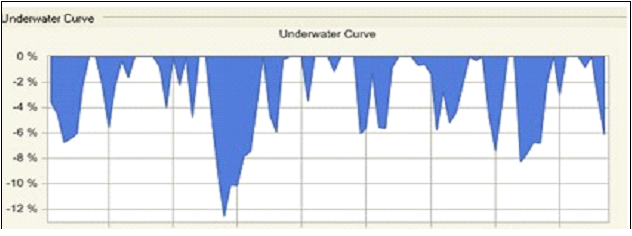
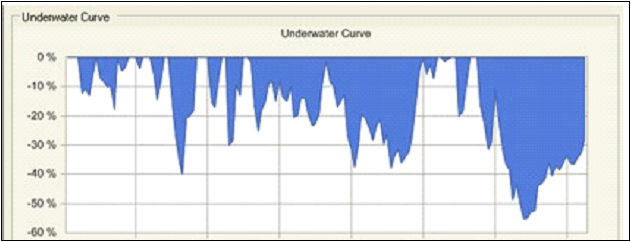
There is a statistical concept known as the “underwater curve.” The underwater curve plots the time periods when new all-time high NAV levels are being registered (represented by “0” on an underwater curve) and the time periods in which Drawdowns are either underway or in recovery back toward new all-time NAV levels.

Most successful long-term traders are underwater the majority of time. Welcome to trading!

The graphics herein show the underwater tables for Factor LLC (for the period listed) and several unnamed but highly successful futures/forex trading firms (for identical 5-year periods)
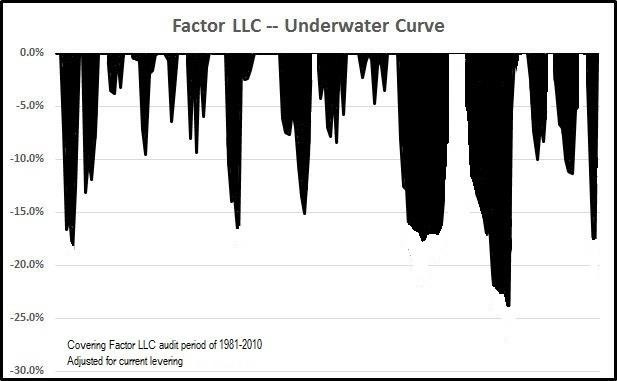
 

Trading Drawdowns - underwater Curve - Factor Trading - Peter Brandt

Factor LLC:

  • Annual Compounded ROR (ACROR) = 41.6%,
  • MAR = 1.8,
  • Gain-to-Pain Ratio = 2.4


The reality is that during decades of market speculation I have spent far more time in or recovering from Drawdowns than time posting new NAV highs.


Trader A – Annual Compounded ROR (ACROR) = 20.3%, Calmar = 1.9

Trader a


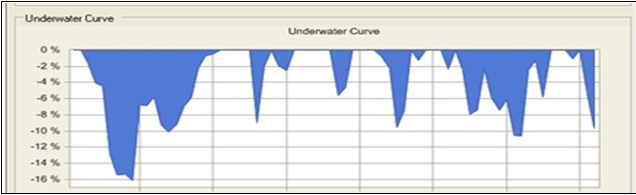
Trader B – ACROR = 19.4%, Calmar = .43

trader b

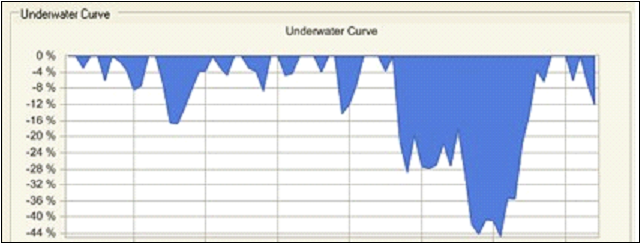
Trader C – ACROR = 19.4%, Calmar = 2.34

trader c


Trader D – ACROR = 18.8%, Calmar = .34

trader d

There are scientific reasons why successful traders are underwater the majority of the time

A “MUST” view is the presentation of an analysis of 180 years of market drawdowns (focused on U.S. stocks, but applicable to any and all trading operations) by Dr. Robert Frey to the Institut des Hautes Etudes Scientifiques in 2015. All serious traders and investors should take the time to understand the statistics behind Trading Drawdowns as presented in this YouTube video. Note the selected statements from the presentation to the right of Robert Frey’s photo.

Some selected statements:

  • “Most of the time even when we are in a good investment, we are in a state of regret.
  • “You are going to bed with an upset stomach because you have lost money most of the time and do not know what is going to happen”
  • “You are in a drawdown state 80% of the time and of that, you are in a severe drawdown state (greater than -20%) 67% of the time”
  • “Most of the time an investor is facing a market of regret…”


Beware of false claims by wolves in sheep’s clothing


sheep wolf


Successful market speculation is one of the most challenging endeavors one can pursue. Yet, promoters of get-rich- quick-and-easy schemes run rampant in the email and internet worlds. If they are not registered with the SEC, FINRA or the CFTC/NFA or are not personally managing assets of investors they are free to make exaggerated claims. Their advertising is extremely appealing and enticing. Many of these training and trade signaling services claim to have REAL trading track records. But, as far as I am able to determine, none are willing to provide an attestation or audit letter from a national or regional auditing firm that has reconciled their IRS tax payments for trading profits, brokerage statements and bank deposits with their public claims.


Factor Membership

Factor Membership is available and you could consider your membership in the Factor Service as just one more trade. If the Factor Service is not of value to you, well, it is just one more trade that did not work.   Through the Factor Service I endeavor to alert novice and aspiring traders to the many pitfalls you will face – and to offer advice on overcoming those pitfalls. My goal is to shoot straight on what trading is all about.  For more information watch my 30 minute webinar where we cover the Factor service in depth.

I hope you will consider joining the Factor community.

sig


###


Factor Update – April 3rd

This content is for members only

What trading over the course of five different decades has taught me about drawdowns

 Trading Drawdowns

Traders talk a lot about Trading Drawdowns. But what are they exactly? How are they measured? What do they mean? Can they be prevented? If not, how does a trader deal with them.
In the world of futures and forex, Trading drawdowns are measured based on month-end to month-end net asset value (or nominal account value). I know a number of traders who will measure drawdowns on a week-ending basis. I really do not know many traders who measure drawdown levels on a day to day basis. I was clipped today by about 170 basis points (1.7%), but that is not a drawdown. Day to day asset volatility does not represent a drawdown.


It is especially dangerous (from an emotional perspective) for novice traders to be intraday equity watchers. This is NOT a habit you want to get yourself into. As a chartist, I want to trade the charts, not my equity level. I do not want intraday — or even day to day — volatility in equity balance to affect my judgement.

The question a chartist should ask is: “Did today’s price action do damage to the technical case in a market?” Whether a position lost money is not the issue — nor should it be. I will tell you that every position I held today except one lost money. But not a single position experienced technical damage. If a trade is not digging into my pocket or experiencing technical damage, and if I am not over leveraged, then why should I pull the escape hatch?


I know traders who have “circuit breakers.” whereby if they reach a certain daily loss level they liquidate all positions. For me, a daily loss of 3% or more would force some examination of my positions. But, the chances are great that a daily loss of 3% of capital or more is an indication of being over leveraged, and that is a separate (but more deadly) issue.

Drawdowns are a fact of life for a trader. They happen. There will be bad days and bad weeks and bad months, and periodically even a bad year. A losing day/week/month is not an indictment against a trading plan. In fact, drawdowns are to be expected and a trader must learn to take them in stride without pulling the escape hatch whenever a position turns into a daily loser.


A benchmark metric maintained by many professional traders is their Calmar ratio. The Calmar ratio is calculated by dividing the worst drawdown (month-ending basis) into the average annual rate of return for some measure of time. A rolling three-year period is the most frequent time measure for determining Calmar. A Calmar ratio of 2.0 is considered outstanding — 3.0 is world class. Some short gamma traders (naked options sellers) can generate Calmar ratios of 5.0 or even higher — that is, until they go broke, which they eventually will.
The practical implication of a Calmar ratio of 2.0 is that to achieve an average annual ROR of 30% you will likely experience a worst-drawdown of 15% or greater (month-ending). Keep in mind that a month-ending worst drawdown of 15% probably equates to a week-ending worst drawdown of 20% or greater.


Now, if your trading approach frequently experiences daily equity swings of 3% or more, then you have some issues that need to be dealt with. But, equity swings less than 2% daily (or 5% monthly) must be expected.
If you cannot handle Trading Drawdowns, then my advice to you is simple — quit trading and take up gardening or knitting.

Factor Membership is now available.  You could consider your membership in the Factor Service as just one more trade. If the Factor Service is not of value to you, well, it is just one more trade that did not work.   Through the Factor Service I endeavor to alert novice and aspiring traders to the many pitfalls you will face – and to offer advice on overcoming those pitfalls. My goal is to shoot straight on what trading is all about.  For more information, visit the home page here.  Or watch my 30 minute webinar where we cover the Factor service in depth.

I hope you will consider joining the Factor community.

sig


##