
Factor Update, June 25, 2017
This content is for members only


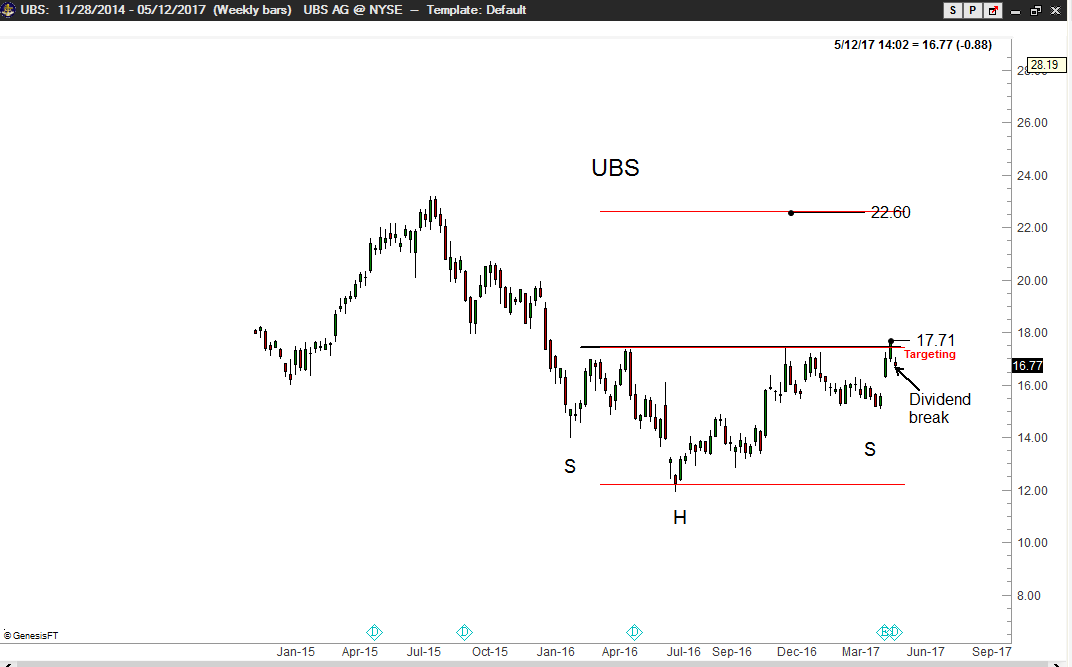
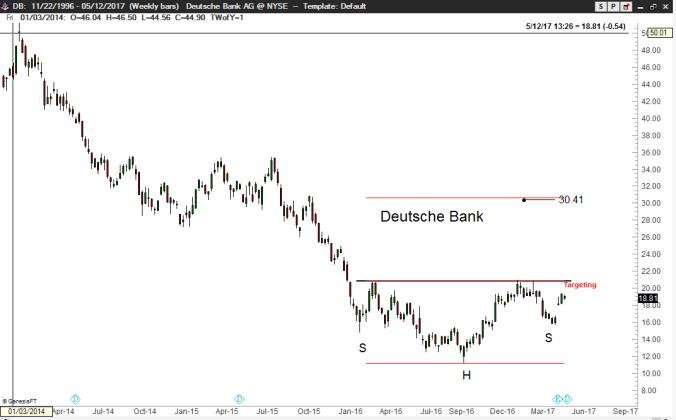
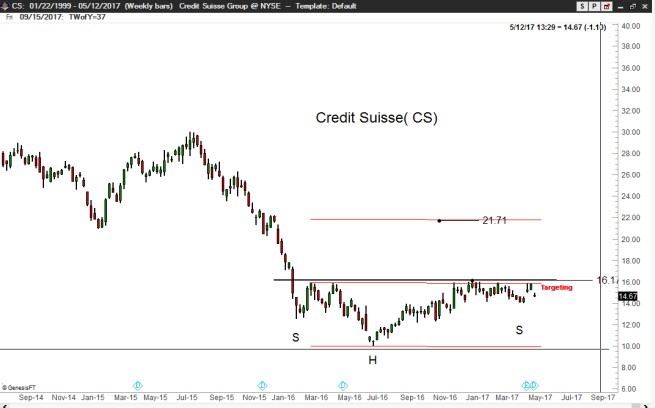
Huge H&S bottom patterns continue to form on the weekly graphs of some major European banks. UBS, Credit Suisse and Deutsche Bank are shown in the charts below.
UBS traded through its neckline, but the ex-dividend adjustment put prices back under the breakout level. Factor is flat, but I would consider buying UBS if it climb above 18.01.
.
Peter Brandt is a 40+ year veteran of trading. Through his Factor Service, members receive:
.
View your Factor Member options here. You could consider your membership in the Factor Service as just one more trade. If the Factor Service is not of value to you, well, it is just one more trade that did not work. Through the Factor Service I endeavor to alert novice and aspiring traders to the many pitfalls you will face – and to offer advice on overcoming those pitfalls. My goal is to shoot straight on what trading is all about. For more information watch my 30 minute webinar where we cover the Factor service in depth.
I hope you will consider joining the Factor community.


.


![]()
