
Factor Update – September 25, 2016
This content is for members only


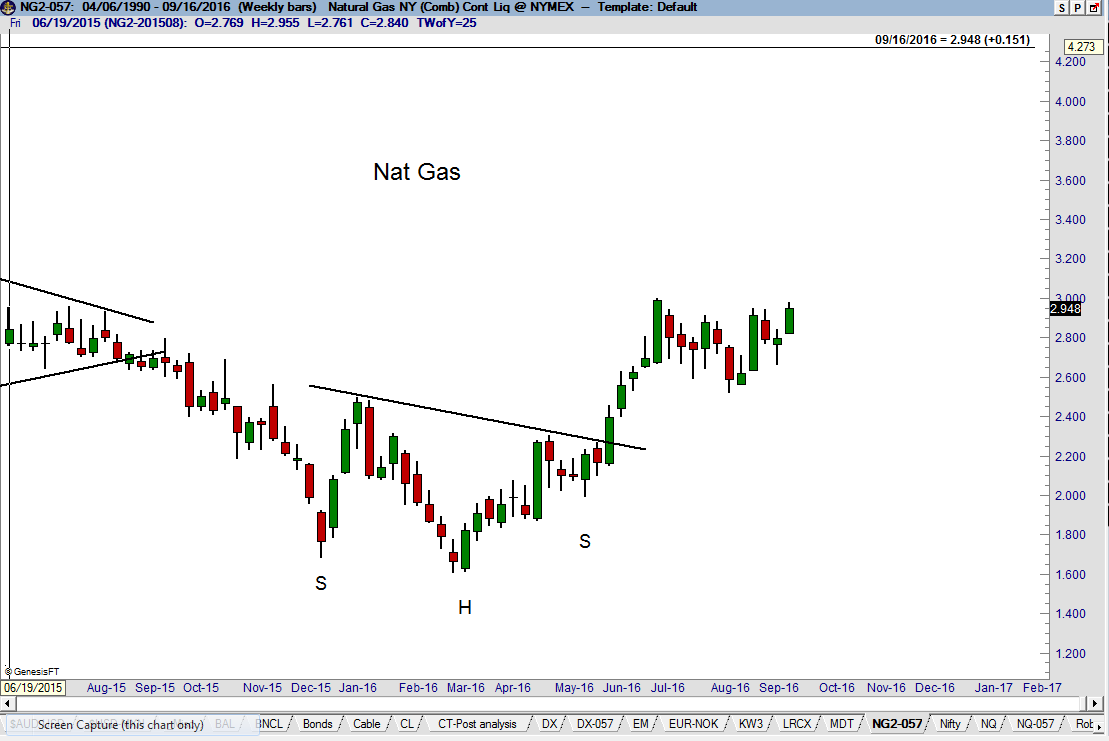

 The bottom took the form of a 7-month H&S bottom on the daily and weekly charts. The target of this H&S at 2.934 was quickly met on Jun 29. The Factor participated in this H&S pattern in its proprietary account and discussed the pattern in the Factor Update.
Read More
The bottom took the form of a 7-month H&S bottom on the daily and weekly charts. The target of this H&S at 2.934 was quickly met on Jun 29. The Factor participated in this H&S pattern in its proprietary account and discussed the pattern in the Factor Update.
Read More


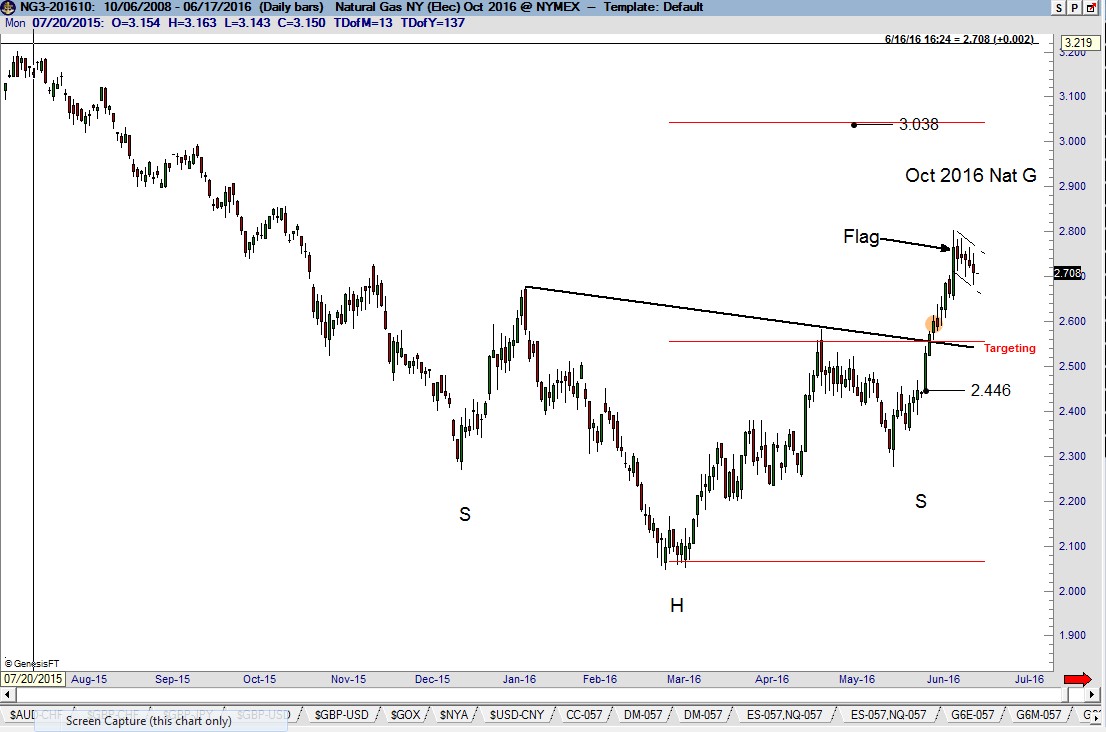
The dominant chart construction in Natural Gas is the completed 7- month H&S bottom on the daily graph (Oct contract). Note the appearance of a possible 6-day flag on the Oct chart. Factor is long Natural Gas and members were alerted of this buy with our premium reports section.
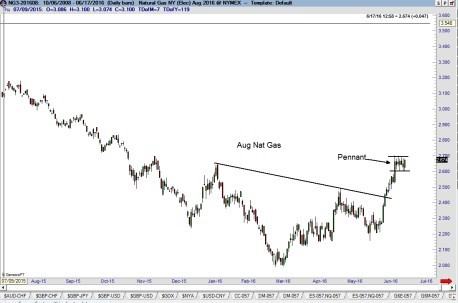
The chart of the soon-to-be nearby Aug graph displays a pennant, not a flag (see below). The difference is that a flag is a diagonal correction while a pennant is a horizontal correction. A pennant is more constructive than a flag. That the nearby Aug Natural Gas contract displays a pennant while the Oct contract displays a flag is a constructive indication – in my opinion, for whatever that is worth.
Factor Membership is now available. You could consider your membership in the Factor Service as just one more trade. If the Factor Service is not of value to you, well, it is just one more trade that did not work. Through the Factor Service I endeavor to alert novice and aspiring traders to the many pitfalls you will face – and to offer advice on overcoming those pitfalls. My goal is to shoot straight on what trading is all about. For more information, visit the home page here. Or watch my 30 minute webinar where we cover the Factor service in depth.
I hope you will consider joining the Factor community.

##


![]()
