

Is it a massive Natural Gas Head & Shoulders bottom?
Is it a massive Natural Gas Head & Shoulders bottom?
I last covered the Natural Gas market within the public blog back on June 20th, with the post “Natural Gas Rising“. Natural Gas posted a 21-year price low in Mar 2016 and the bottom took the form of a 7-month Natural Gas Head & Shoulders bottom on the daily and weekly charts. The target of this H&S at 2.934 was quickly met on Jun 29. The Factor participated in this H&S pattern in its proprietary account and discussed the pattern within the Factor member Updates (See here for details on the Factor Service).
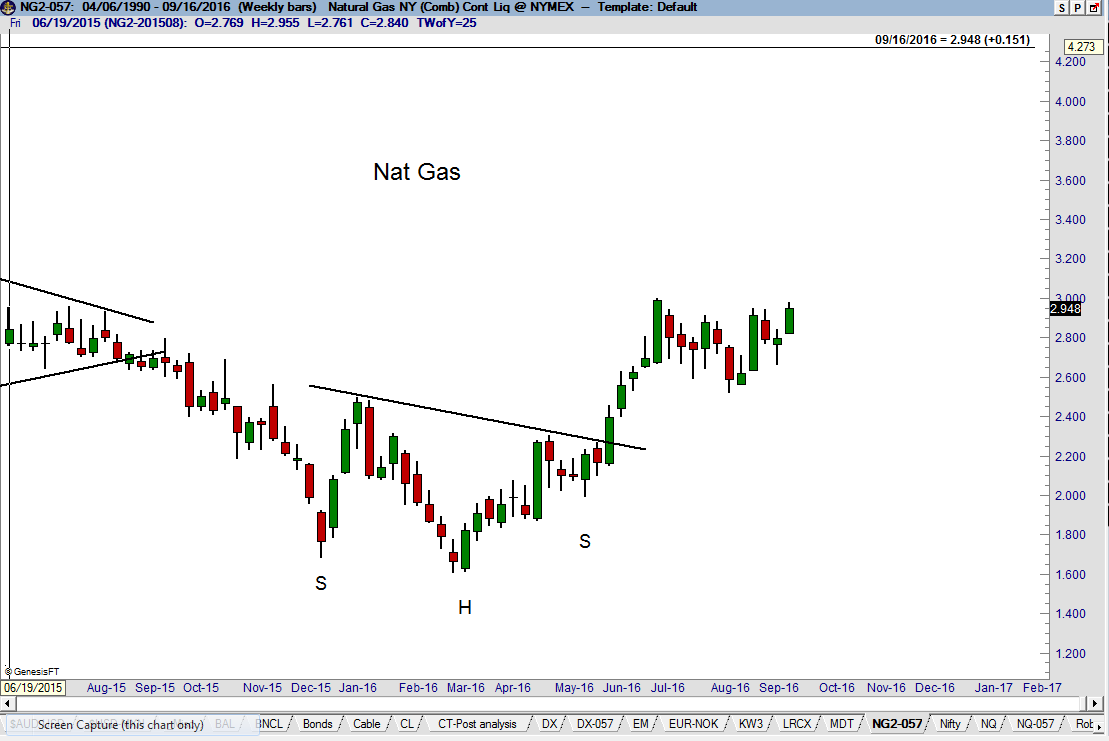
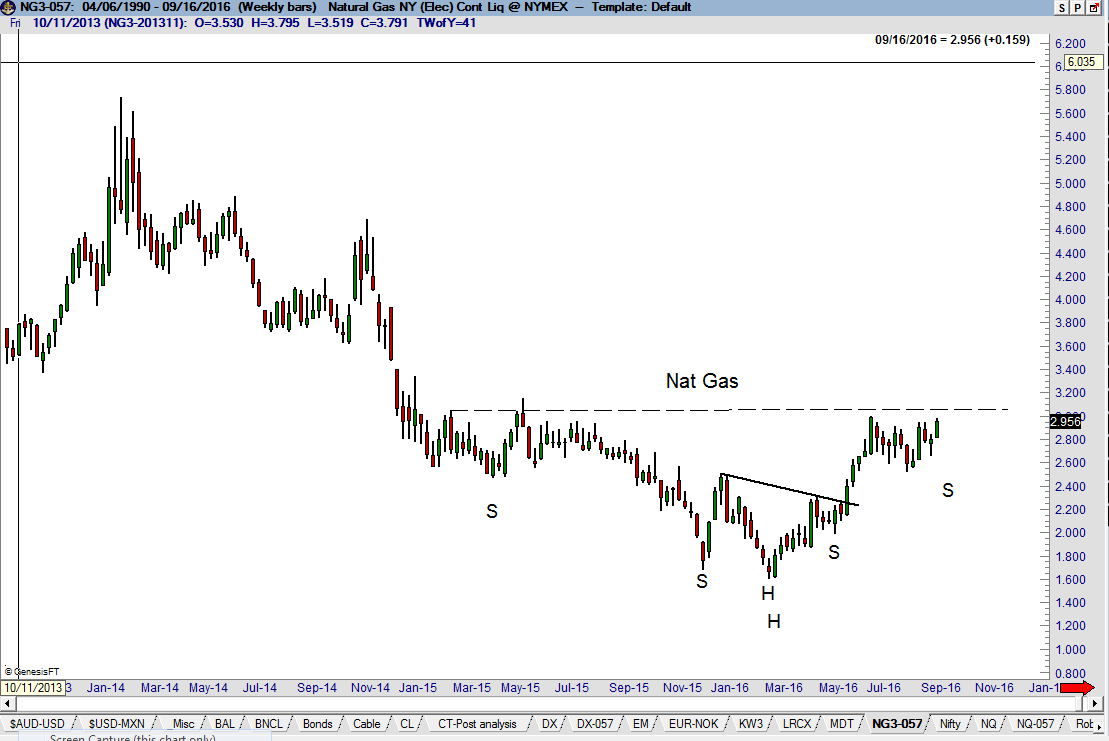
A case can now be made that the weekly chart is forming a 21-month Natural Gas Head & Shoulders bottom, as shown below. I have some significant issues with this interpretation. One problem is that the right shoulder is too abbreviated in relationship to the left shoulder. A second problem is that there is no overlap between the two shoulders on the charts of the individual contract months (not shown).
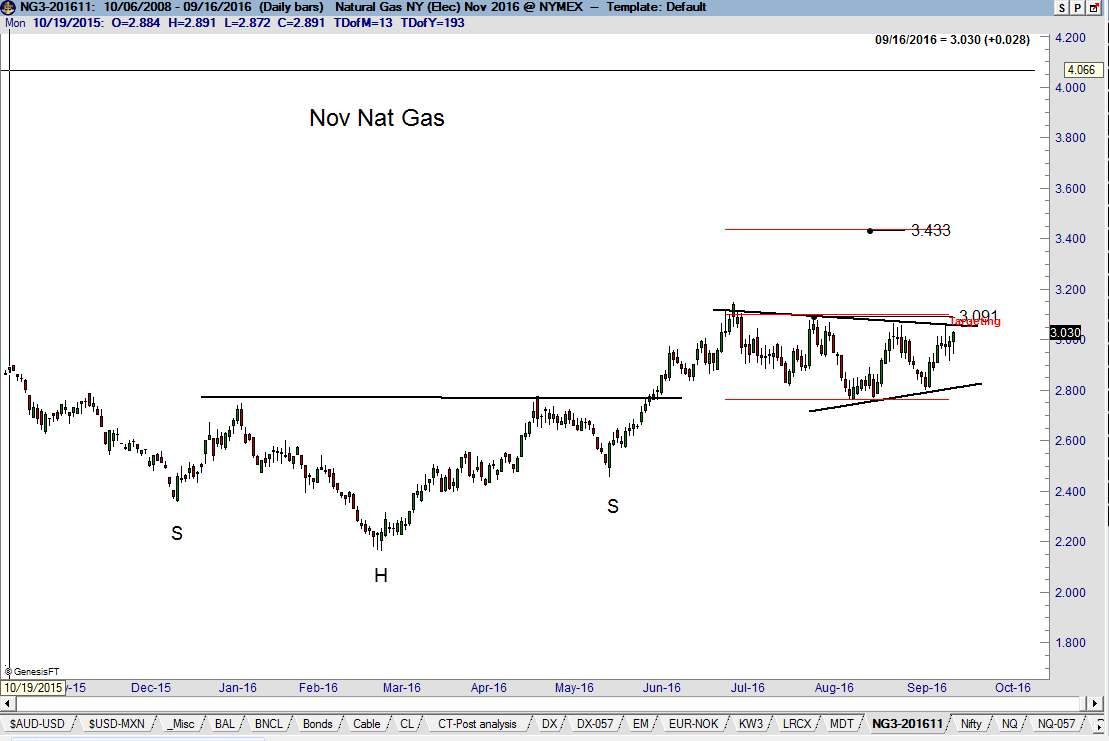
I prefer to view the period since July 1 as simply an 11-week consolidation within a primary bull trend. A decisively close above 3.091 (Nov contract) would complete this consolidation and establish 3.433 as the next target level.
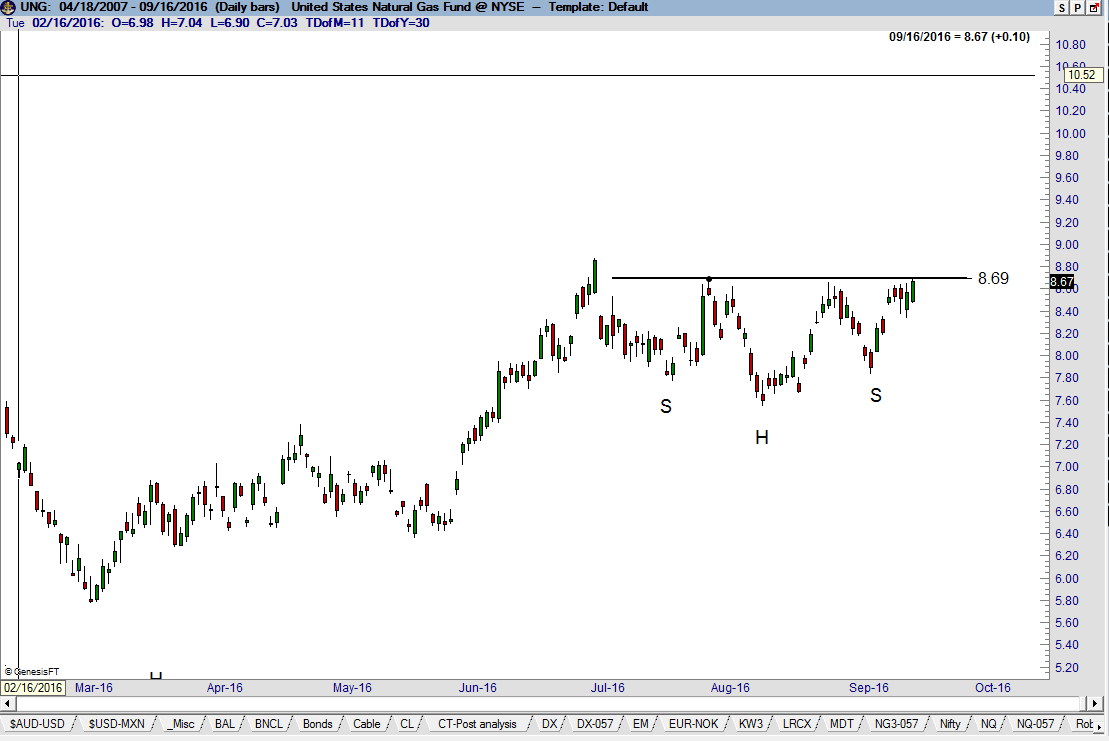
UNG (the Natural Gas ETF) displays a very clear 10-month H&S bottom.
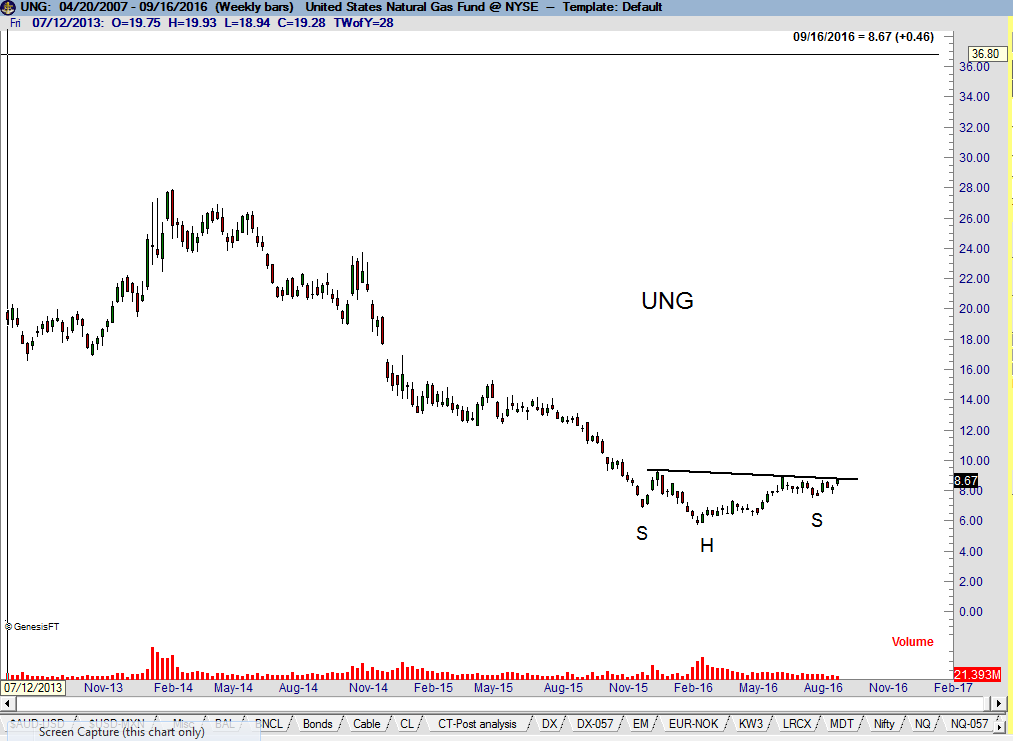
Investors who attempted to buy the Natural Gas market with UNG lost money continually from Jul 2008 through May 2012 despite periodic rallies in the underlying product.
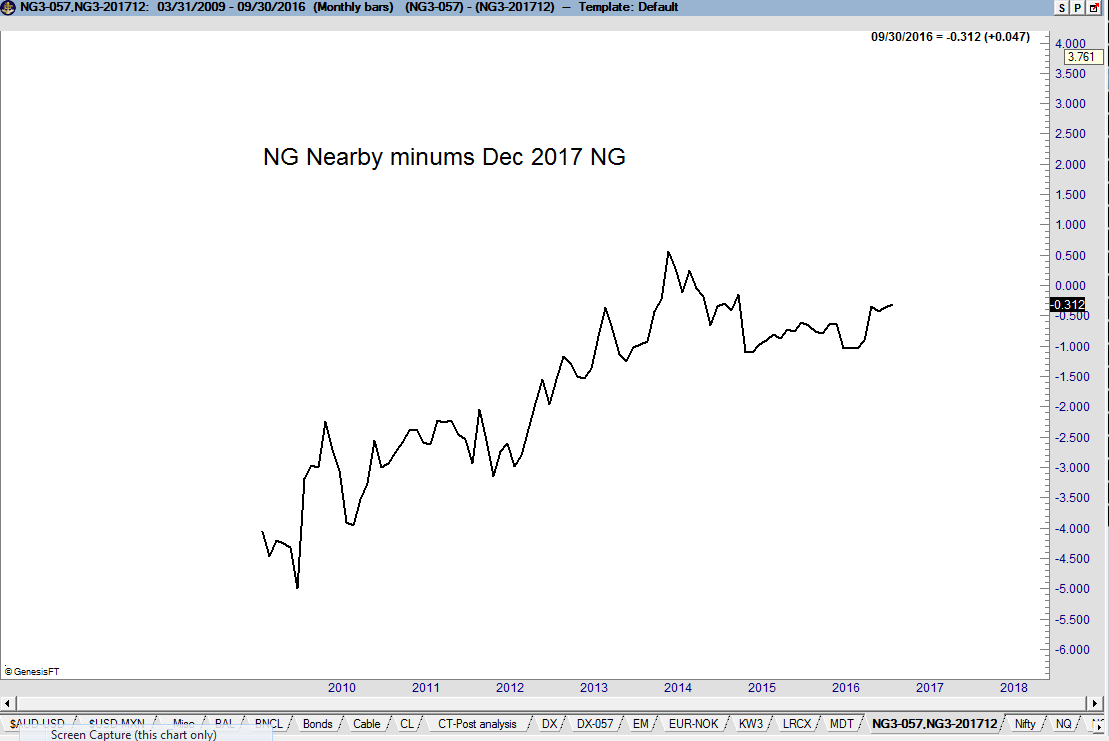
UNG was a terrible investment vehicle due to the large carrying charge structure of the futures market. However, the huge carrying charges have disappeared in Nat Gas. As the chart below shows, Dec 2017 contract has gone from nearly five full points carry to the near contract to almost even money. The one-year carrying charge in Nat Gas (Dec 2016 to Dec 2017) is currently only .05. Thus, the carrying charge disincentive to own UNG has all but disappeared, making UNG a legitimate play.
The daily graph of UNG displays a 12-week continuation inverted H&S with a horizontal neckline at 8.69. Using the 3% breakout rule of Edwards and Magee, a close above 8.95 in expanded volume would be a valid breakout in UNG.
Factor Membership
Factor Membership is available and you could consider your membership in the Factor Service as just one more trade. If the Factor Service is not of value to you, well, it is just one more trade that did not work. Through the Factor Service I endeavor to alert novice and aspiring traders to the many pitfalls you will face – and to offer advice on overcoming those pitfalls. My goal is to shoot straight on what trading is all about. For more information watch my 30 minute webinar where we cover the Factor service in depth.
I hope you will consider joining the Factor community.

###


