Are the commodity and forex markets changing? Trading Commentary 03.30.2011
The markets, they are a’changin!
Electronic exchanges! High volume trading! Mega volume operators! Indicator optimization! Web-based trading platforms! Twenty-four hour markets! A trend by the small speculator toward day trading, especially in the forex markets!
Have all these evolutions in the commodity and forex markets from even a decade ago produced changes in the basic price behavior of these markets.
The answer is both “yes” and “no.” “No” in the sense that markets still go up and down according to governing macro economics and the laws of supply and demand of the underlying commodity or forex pair. Of course, the buying and selling activities of market participants (reflected as supply and demand of the contracts representing the underlying product – as opposed to the supply and demand of the underlying products themselves) – have a significant impact on price behavior in the short- and intermediate-term time frames.
Yet, the answer is also “yes” – especially from the standpoint of a trader (such as me) who uses classical chart patterns for signal generation and risk control. It is important to emphasize that change in price behavior, even if short term, can never be used as an excuse by a trader for negative performance. Traders cannot blame the markets or high volume trading operations or electronic exchanges or external factor for negative performance. Rather, evolutionary changes in price behavior must eventually be addressed by corresponding modifications in a trading plan or system. A trader must operate according to aviation’s “pilot in command” ruling doctrine – full and complete responsibility!
But I know for a fact that short-term market behavior today is different today than it was a decade ago – and it is revolutionarily different than what it was when I started trading three decades ago.
As a chart pattern trader, I feel these changes in market price behavior primarily in the following ways:
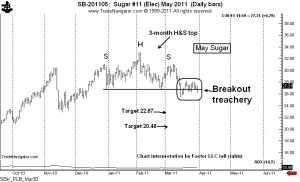
- An increase in the frequency of premature or false pattern breakouts. In short, classical chart patterns are less reliable today than a decade ago. This is especially true of patterns shorter than three months in duration and less true of longer-duration weekly chart patterns. A great example of this is my involvement in the Sugar market in recent weeks. (Click on chart to enlarge.)
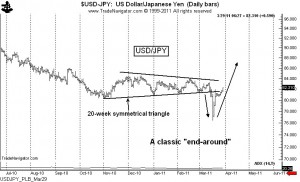
- It has almost become a certainty that shorter-term patterns morph into a new slightly longer-term pattern which then morphs again and again. Nearly each morph produces a losing trade if a position is held long enough.
- Even in those cases when patterns work, the breakouts are sloppier, meaning that it requires several entry attempts with higher leveraged positions or taking positions with far less leverage, but giving the breakout more room to work.
- Intra-day noise has increased markedly. More than ever before, the only thing that matters is the price at the close. Closing price charts are becoming increasingly more important to me. Making decisions based on intra-day prices has proven to be costly.
- Nighttime price behavior, especially a thrust away from the previous day’s closing price, is extremely unreliable.
Over the years I have refined and closely monitored my trading program based on different types of trading signals and trade management protocols. I do a significant amount of analytical work to determine the degree of synchronicity between signal types/trade management techniques and actual price behavior. In short, I know what parts of my plan are working and what parts are not working.
Based exclusively on classical chart patterns, my trading signals have been defined in four categories.
- Weekly chart patterns of six months or longer in duration – reversal or continuation
- Daily chart patterns (with confirmation from weekly charts) of 10 to 25 weeks in duration – reversal or continuation
- Daily chart patterns of six to nine weeks in duration – continuation only
- Daily chart patterns (continuation only) less than six weeks in duration
The Factor Trading Plan has used three broad categories of trade and risk management techniques (with a lot of nuances within each category).
- Trades are given a wide berth, stops moved hesitantly, profits taken at the target
- Trades are given moderate berth, stops moved actively according to rules, profits taken at the target
- Trades are guarded tightly, stops moved quickly and aggressively, quick profits taken (at a predetermined dollar profit target or within the first two or three days)
All of these components – both signaling and trade management – evolved for specific reasons and have contributed to a profitable net bottom line over the years.
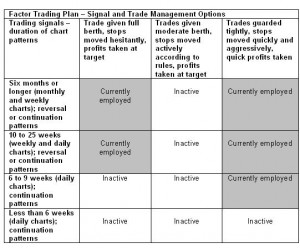
Yet, the nature of current price behavior has significantly and negatively affected some of the components more than others. As a result, I have now modified my trading approach as shown in the grid below (click on table to enlarge):
What this grid reflects is that my trading profits in the past 18 months have come from two types of trades:
- Holding position trades based on extremely long weekly chart patterns, or,
- Taking very quick profits from patterns of six weeks or longer in duration.
These two types trades are shown in grey in the grid above.
For the purpose of full disclosure, let me now reveal the ugly side of this discussion. I would be sitting pretty if only I had adopted this template 18 months ago. I have been far too slow to adjust my trading profile. This is in large part because I am very adverse to modifying my trading plan based on the results of the most recent trades, series of trades, weeks or even months. A big trap for novice traders to escape is the thinking, “I need to change my trading approach based on the last five trades.”
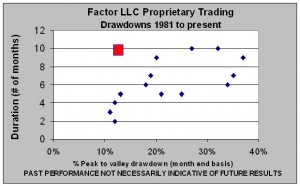
The white portions of the grid have produced net losses during the past 18 months. As a result, my trading account is currently in a drawdown of around 12% from previous all-time peak NAV levels in May 2010. A 12% drawdown is not a disaster by any stretch – I have experienced drawdowns of at least 12% in the majority of years since 1981.
The graph below plots the 15 drawdowns of at least 10% I have experienced in trading, with the current drawdown noted in red. (Click on graph to enlarge.)
I cannot leave this discussion without covering a very important point. I am NOT a believer in optimization. I think that optimization – especially optimizing indicators such as moving averages, stochastics and the like – is a loser’s game in the hands of anyone other than a very experienced market operator with significant quant abilities.
Yet, in a real sense, my dismissal of certain components within my trading program is a form of optimization. I believe that the decision to move to long-term holding periods based on weekly charts in combination with very short-term swing or scalp trades is based on a conceptual understanding of the evolution and realities of market behavior.
I run the risk, of course, that the exact components being dismissed could be the best performing components in the next 18 months. The role of trader is to make a decision, step up to the line, and place bets to the best of his or her ability. At the end of the day, making decisions and placing bets are what traders do.
###


