
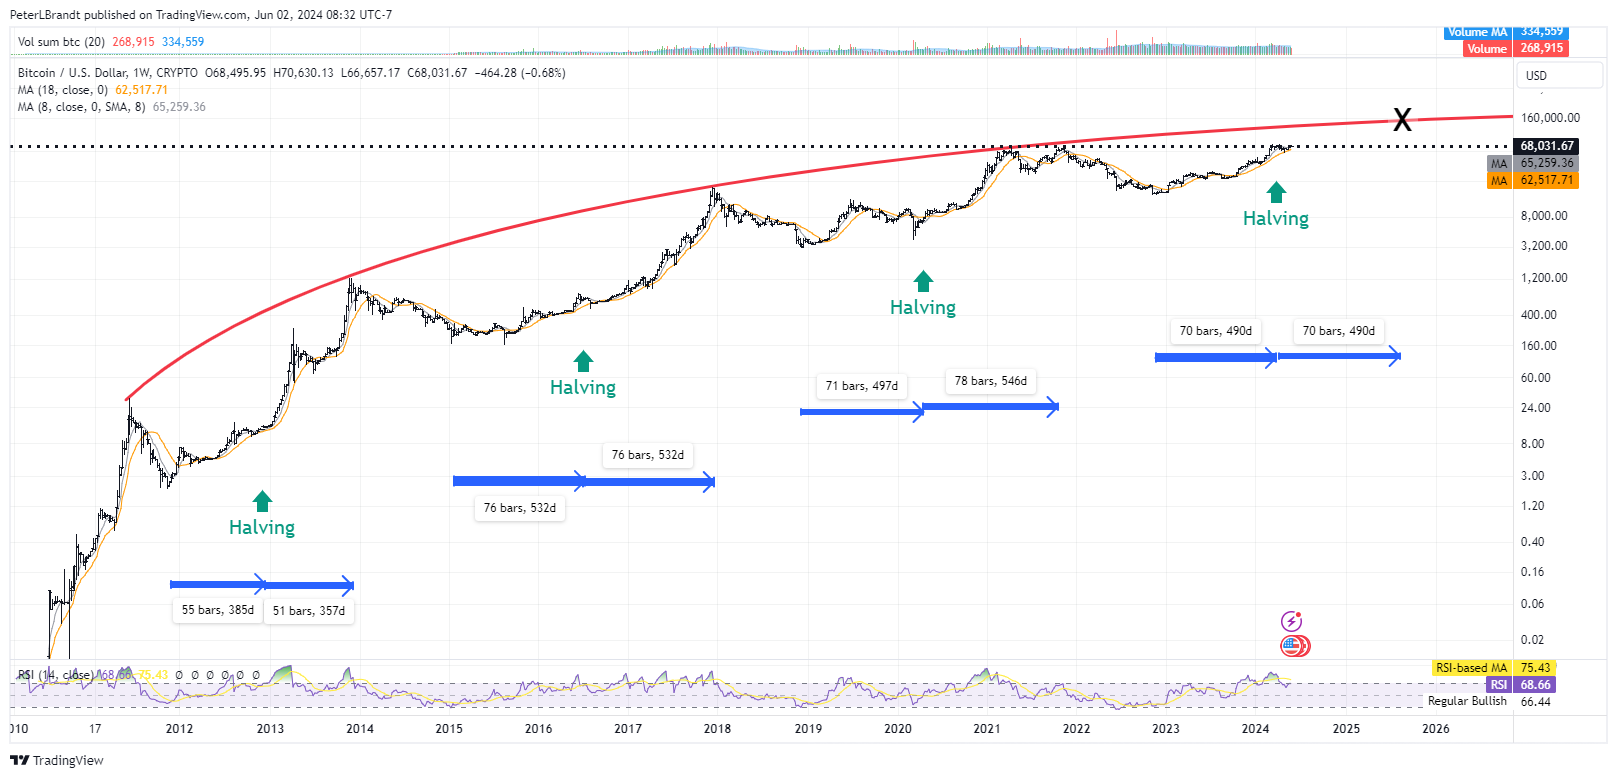
The beautiful symmetry of past Bitcoin bull market cycles
The “Halvings” have represented the half-way points of past bull market cycles
The Bitcoin Halvings are those dates when the mining rewards are cut in half from the previous halving cycles. Remarkably, the Halving dates have also represented almost perfect symmetry within past bull market cycles.
More specifically, the number of weeks from the start of each bull market cycle (the low following a 75%-plus decline) to the Halving dates has been almost equal to the number of weeks from the Halving dates to the subsequent bull market highs, as shown on the chart herein.
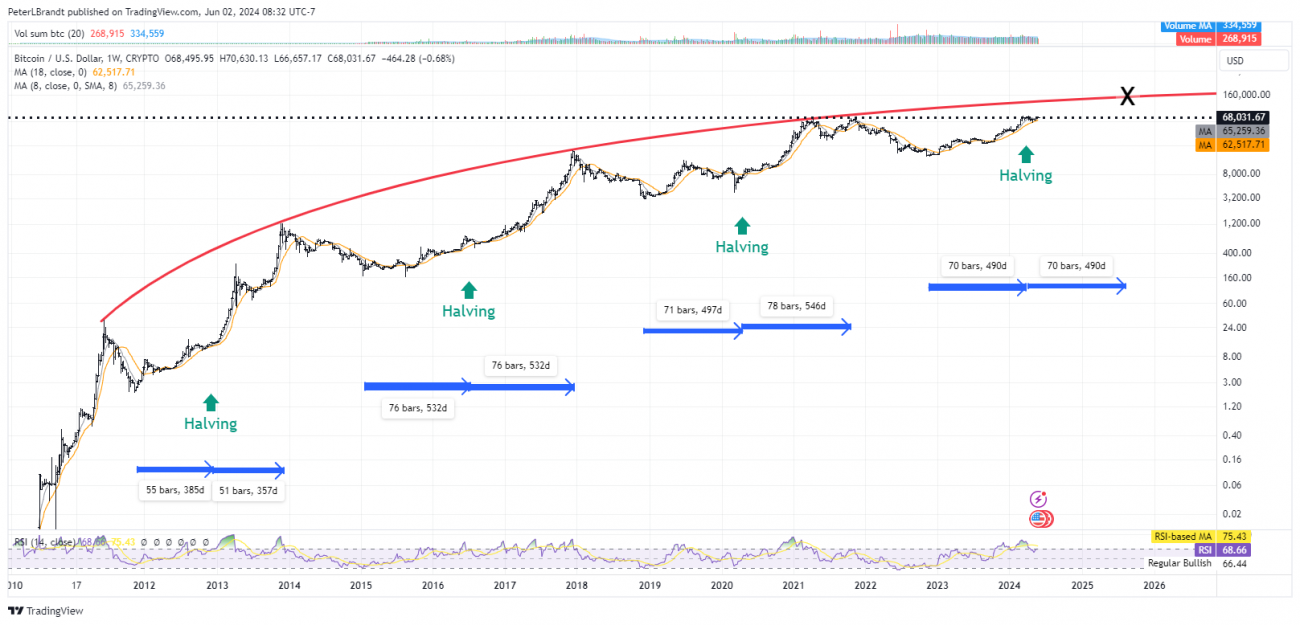
If this sequence continues, the next bull market cycle high should occur in late Aug/early Sep 2025.
How high might Bitcoin go in this bull cycle? No method of analysis is fool-proof, but it should be noted that the highs of past bull markets line up quite well against an inverted parabolic curve. Should this tendency also continue, the high of this bull market cycle could be in the $130,000 to $150,00 range. The X on the chart marks the probably high date and price level.
Note: As a trader I avoid being dogmatic about any idea. While the view presented in this post is my preferred analysis, it is not my only interpretation. I continue to place a 25% probability that Bitcoin price has topped for this cycle. You can view this analysis here: https://www.peterlbrandt.com/does-history-make-a-case-that-bitcoin-has-topped/ Should Bitcoin fail to make a decisive new ATH and decline below $55,000 I will raise the probability of the Exponential Decay.
End.


