
Factor Interim Update, October 2, 2016
This content is for members only


Let me guess two things from the question. First, my guess is that the drawdown was deeper than it should have been and that it consisted of at least several trades that went from initial profits into losses. Because of this fact he is now fearful of present profits turning into losses. Second, my guess is that the member had not as buttoned up on rules and guidelines for managing open trades as he would like to be – and this fact makes it easier to second guess the outcomes of each and every trading event.
He asked if this situation ever happens to me. The answer — When doesn’t it happen to me? Welcome to the world of Trading Psychology and discretionary trading. I wish I could sound brilliant in answering the question, but unfortunately the war he describes is not one for which I will ever claim complete victory. Human emotions are the biggest enemy a trader faces. This is one reason I am so critical of the self-proclaim “geniuses” who peddle trade identification and win rates as the pinnacle of trading achievement. Unfortunately, there are no easy answers to this dilemma – and each discretionary trader must find ways to win individual battles within the larger war against self. I am not even sure that the specific “peace treaties” I have negotiated over the years with my inner enemies are the best solutions for all other traders.
Overcoming self and mastering Trading Psychology is an individual struggle – this is why consistent long-term traders have developed a tremendous and unbiased awareness of self. When I came into the trading business in the mid-1970s there was a saying around the Chicago Board of Trade that went something like this … “If you want to know yourself – all your insecurities, character faults, issues of pride, areas of greed or selfishness, unresolved traits, etc. – just become a trader. How true! Self-awareness and managing the Human Side of Trading is a hallmark of every great trader I have known over the years.I can describe some of the steps I have used to create a peace treaty with fear, false hope and greed.
Traders who do not have specific trade management rules and guidelines face the biggest emotional turmoil because it becomes so easy for them to second-guess every decision – and this leads to the vicious cycle:
The reality of trade management is that rules, guidelines and decisions CANNOT be optimized. If you come up with all the answers to this trading dilemma, please let me know.
Peter Brandt is a 40+ year veteran of trading. Through his Factor Service, members receive:
View your Factor Member options here.
You could consider your membership in the Factor Service as just one more trade. If the Factor Service is not of value to you, well, it is just one more trade that did not work. Through the Factor Service I endeavor to alert novice and aspiring traders to the many pitfalls you will face – and to offer advice on overcoming those pitfalls. My goal is to shoot straight on what trading is all about. For more information watch my 30 minute webinar where we cover the Factor service in depth.
I hope you will consider joining the Factor community.


Here at Factor, we receive so many great questions covering Risk Management, Trade Management, Classical Charting Principles, The process of Trading, and the Human Aspect of Market Speculation. As followers of our public blog, we wanted to share just a handful of these Q&A’s with you.

Answer: A continuation graph plots the price of the “front” or nearest futures contract on a rolling basis. I use several types of continuation charts – each different based on when the chart rolls from the nearby contract to the next contract.
-055 – rolls on the first day of the expiration month
There are several things a trader needs to understand about continuation graphs.
(About turning $50,000 into $1,000,000) You are very critical of the promoters of trading systems and training programs that offer promises of huge profits. I share your criticism. Yet, surely you know some traders who have turned $50,000 into $1,000,000 in a matter of a few years. If so, how did they do it?
Answer: I personally know some traders who have achieved this type of profitability. Yet, there are some things all aspiring traders need to understand about 10-fold and 20-fold profitability. First, I know no trader who has achieved this level of profitability with a system or trading approach. Such levels of profitability come from ultra-leverage in very substantial and sustained one-off trends – not by applying day trading techniques learned from a $3,000 trading video. Second, the leverage and risk taken to achieve this level of profitability represent a two-sided coin. I cannot recall a single trader who has achieved a 10-fold or 20- fold return during less than a five year period who has not also experienced at least one 50% drawdown in the process. Herein lies the dilemma – and a question. If you, as a trader, ran a $50,000 account into $1,000,000, then experienced a drawdown back to $500,000, which frame of mind would you have:?
A. You just made $450,000 – what a fabulous thing
B. You just lost $500,000 – what a bummer
There is another dimension to a 10- or 20- bagger that I must mention. A big trading score requires far more than the desire to make it happen, perseverance, incredible patience, discernment, boldness and the right trading tactics. It requires the right markets at the right time in a trader’s career – and that is largely a function of luck. Without the intervention of providence no amount of desire/boldness/trading tactics will make it happen.
Answer: Great question. I am highly data driven and believe the data I have collected on my trading performance over the years is a small gold mine. The metrics I maintain include (but are not limited to) the following.
These are the metrics I believe really matter to performance outcomes.
Answer: Even though I have based my trading on classical charting principles since 1980, the tactical aspects of my trading have evolved over time. There are several areas of my trading today that are modified vs. 2011 – the year “Diary” was published.
Trading frequency – Back in the 1980s and early 1990s I typically made 25 to 30 trades per month. At the time “Diary” was published, my monthly trading frequency had declined to 15 to 20 trades per month. My present goal is to enter no more than 10 trades per month.
Pattern Selection – My focus is on horizontal patterns. While I will trade an occasional symmetrical triangle or wedge, these patterns must meet additional criteria.
Pattern Duration – At the time of “Diary,” I considered patterns of 4 to 10 weeks in length. My focus now is on patterns 10 to 20 weeks in duration. I will trade a smaller pattern if it is part of a larger pattern – either as a launching pad or continuation pattern.
Trade Management – I am much less likely to retain my initial stop levels. I make every attempt to as quickly as possible move a trade to a breakeven proposition.
Factor Members enjoy a monthly live Q&A session with Peter Brandt. They’re also encouraged to send in their questions at any time. The Factor maintains a database of these member Q&A’s on the website so all members can learn from this interaction.
Factor Membership is available and you could consider your membership in the Factor Service as just one more trade. If the Factor Service is not of value to you, well, it is just one more trade that did not work. Through the Factor Service I endeavor to alert novice and aspiring traders to the many pitfalls you will face – and to offer advice on overcoming those pitfalls. My goal is to shoot straight on what trading is all about. For more information watch my 30 minute webinar where we cover the Factor service in depth.
I hope you will consider joining the Factor community.


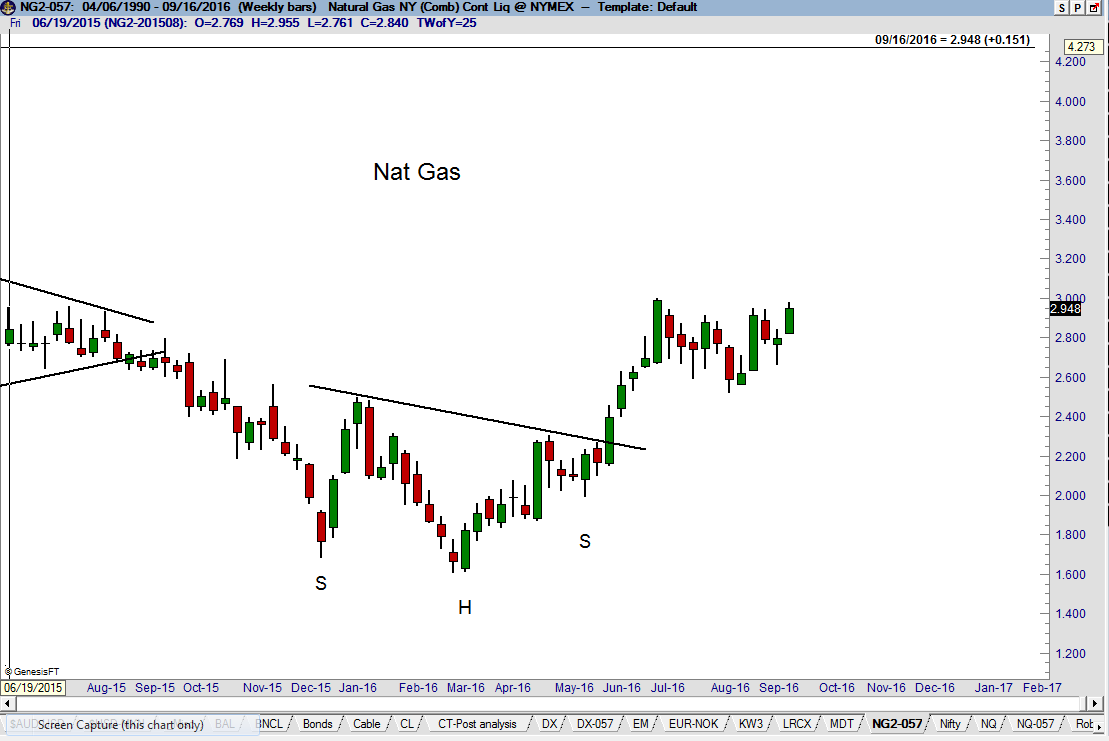

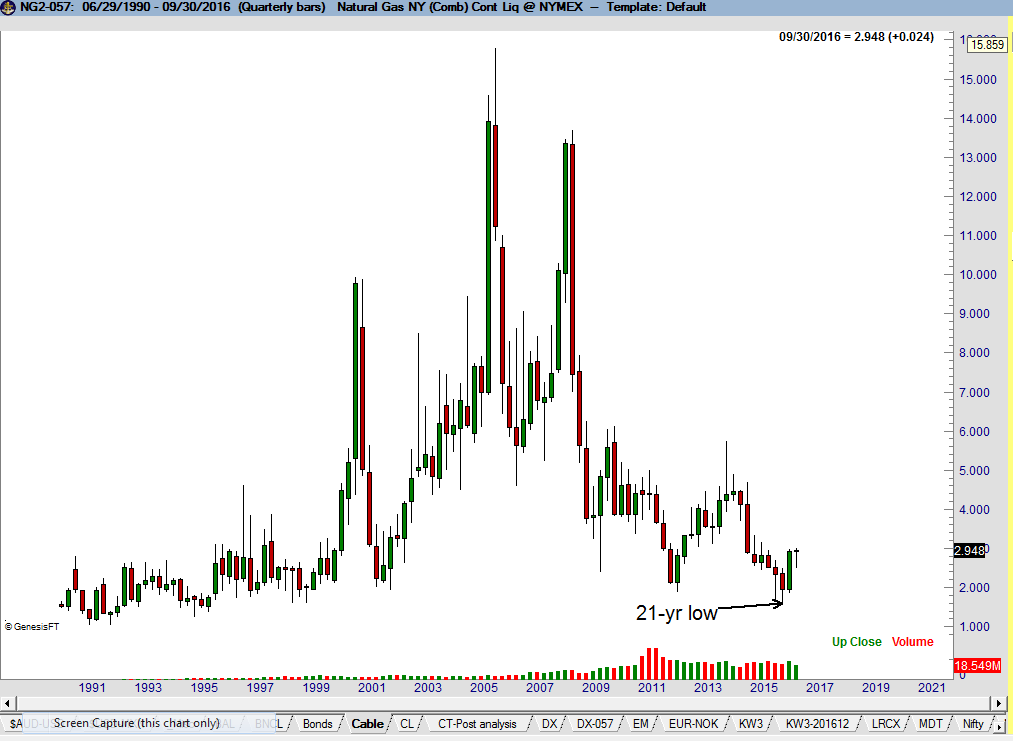 The bottom took the form of a 7-month H&S bottom on the daily and weekly charts. The target of this H&S at 2.934 was quickly met on Jun 29. The Factor participated in this H&S pattern in its proprietary account and discussed the pattern in the Factor Update.
Read More
The bottom took the form of a 7-month H&S bottom on the daily and weekly charts. The target of this H&S at 2.934 was quickly met on Jun 29. The Factor participated in this H&S pattern in its proprietary account and discussed the pattern in the Factor Update.
Read More
![]()
