
Factor Member Webinar September 2026
Recorded Live September 29, 2026
Overview
- Q&A
- When the continuation, the Gann chart, and an individual month disagree — hogs last month, your 'ugly like a pug' Heating Oil composite — what decides which chart gets the trade? And once you choose one, do the boundary, the 0.5-ATR threshold, and the stop all come from that chart, or do you mix them? 1:27
- When you identify a pattern over the weekend, you place a resting stop order for the following week at the required .5 ATR breakout level. But at that point, you don’t yet know the final LDR level because the breakout hasn’t occurred. How do you determine the initial protective stop attached to the order, and do you adjust it daily before the order is filled? 5:25
- You were pounding the table that crude's weekly looked 'explosive' — and you took Heating Oil instead and never touched crude. Walk me through the pass. What kills a textbook-perfect pattern for you? 9:09
- Could you walk through the recent Soybean Meal trade from Sunday setup identification through entry, stop adjustments, and profit-taking? - 12:36
- When your entry fills far from plan — your AUDNZD partial, any chase — does the 70–100 BP first profit anchor to the actual fill or the planned entry? Same for the breakeven move. 16:35
- Can you expand on your trade management after an order is filled? I know you like to aggressively remove risk by moving your protective stop as the trade moves in your favor. If the trade is profitable but hasn’t reached its target, what determines whether you take partial profits or continue holding the full position? 19:02
- When looking at a new contract to trade, how do you decide whether it is suitable, specifically in terms of liquidity/tradability? I found many European equity sector indices to be highly illiquid and hard to manage with stops. 20:49
- Looking at the EuroStoxx banks contract, I see a rectangle where the lower bound has been repeatedly tested; is this a sign of weakness or strength? 22:45
- Can you go over an example of 'transferring' levels from the continuation chart to the monthly chart, e.g., the trade in Corn earlier this summer, how you found entry levels on the continuation chart but placed entry and stop levels of the Dec contract? 24:57
- Do you think trading both futures and stocks is too much? 29:00
- On negated setups: are there any additional criteria (besides price hitting the negation point) that would lead you to consider a setup negated? For example, if price never reaches the negation level, but the trade stalls, takes too long, or the pattern loses its shape, would you still treat it as invalid? 31:10
- How do you determine how many units of risk you take on a potential trade? 33:19
- Looking back over your career, which single rule did the most to protect your equity during long losing streaks? 34:59
- If you were starting today with a small account, what would you do differently than you did in the 1970s? 36:56
- After losing nearly half my equity capital in small caps over the past 5 years (!), I'm shifting to S&P 100 stocks with a rules-based system: hold the top 5 momentum stocks in the S&P 100 (20% each), rebalance monthly, and move 100% to cash whenever SPY closes below its 200dma at month start (I hold metals like gold separately). From a long-term risk management perspective, what is your view on such a strategy - concentrated + momentum + staying away below the 200dma SPY? 38:26
- If a breakout of the iceline in a chart pattern occurs on a big gap, and the entry price is far from the low of the Last Day & Last Full Day, where is the most appropriate place to set the initial stop loss? 40:55
- I’m new to chart patterns. How would you go about learning pattern-based trading if you were starting today? 42:08
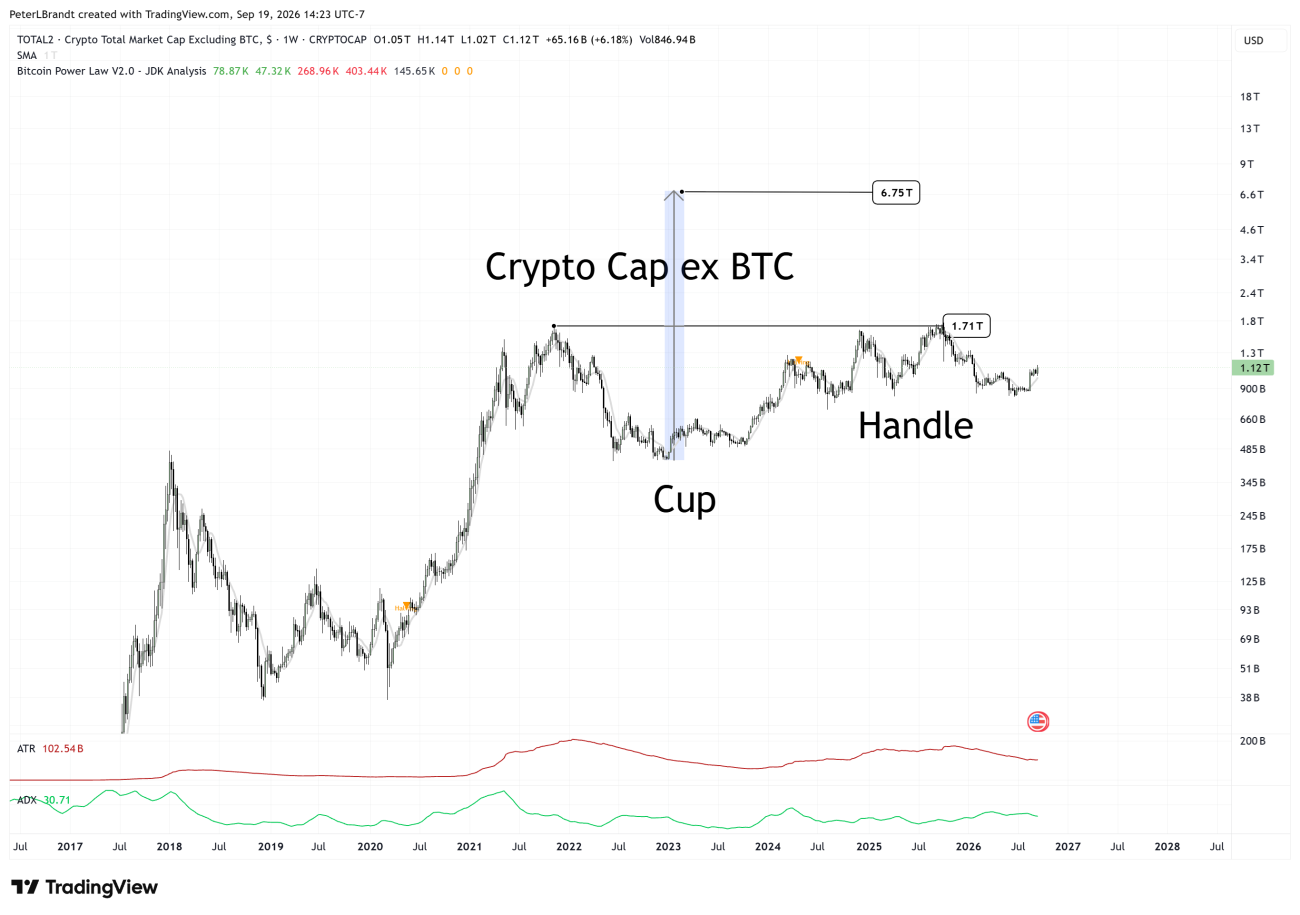
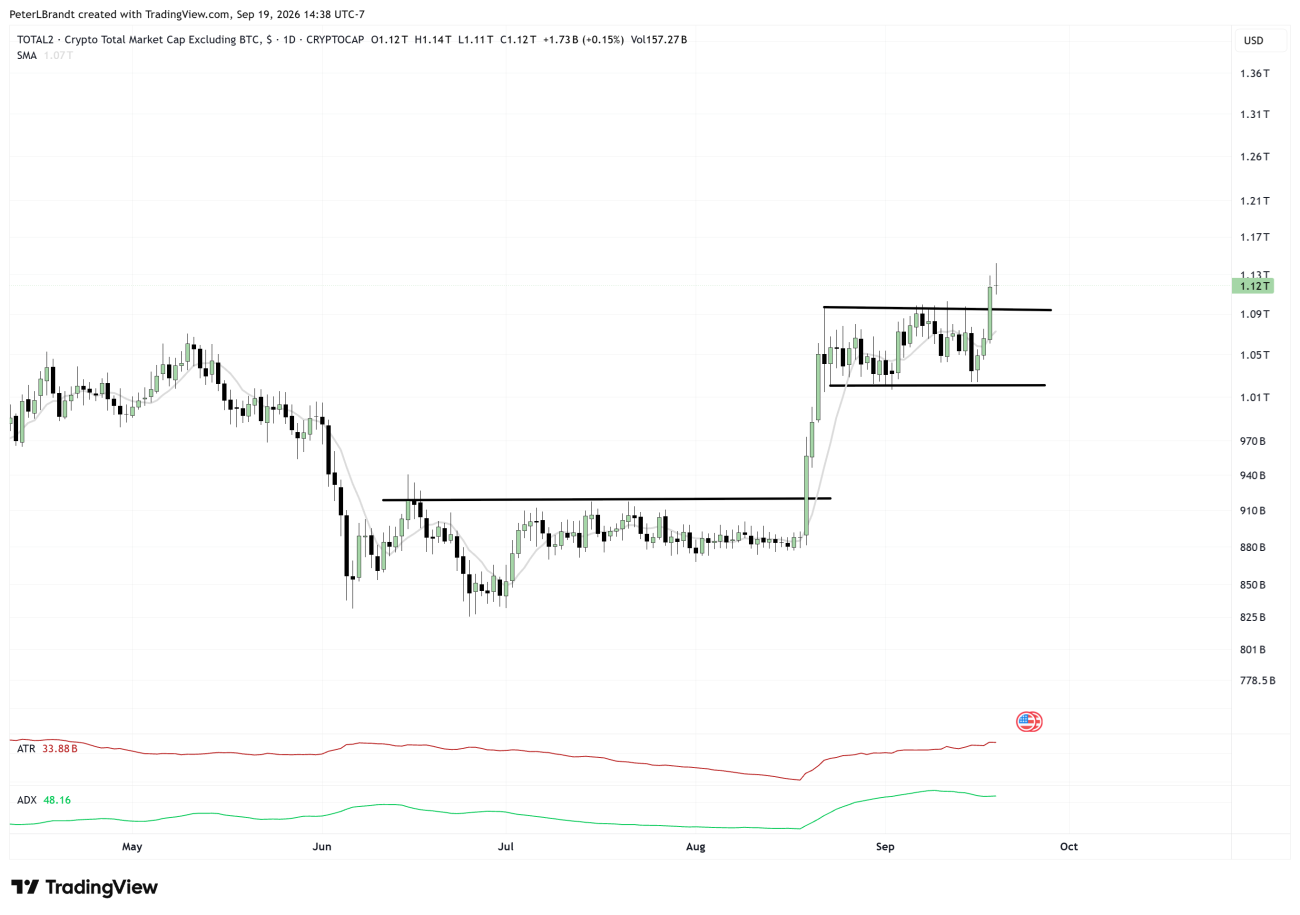
- What do you make of the current Ethereum chart structure? Do you see a classical chart pattern or a well-defined setup here, and what level or price action would you use as the trigger? 43:51
- Is Sugar a valid H & S failure? 46:51
- You've said cocoa is 'not for the undercapitalized.' In 1981 you WERE the undercapitalized. What did you change — skip markets, wider unit risk, different stop logic? Is there a nominal below which the 35-BP unit system doesn't work unmodified? And are micro contracts a legitimate expression or a different trade? 48:18
- Could you also take a look at the U.S. 10-year Treasury yield chart (US10Y)? How do you read the current structure, and are there any key levels or patterns you’re watching? 50:53
- Under what circumstances will you add to a position after the initial entry, and how do you manage the additional risk? 54:02
- My wife & I cataloged at least four trailing methods in your letters — 3DTSR, jammed stops, daily-pivot stops, the 8-DMA Factor Move exit. What decides which one a trade gets, and what makes you switch mid-trade, like Heating Oil moving to a pivot stop for the 2X attempt? 55:20
- How do you use COT data in your trading? 58:39
- Which contract would you use to measure ATR, the continuous contract where the history is longer, or the month you are trading where the history is specific to the trade? 59:27
- What % of your trades typically actually hit the target you list? Are these Pareto trades usually the ones that hit the target? Also, if a trade moves toward your target but doesn't meet it, how do you use the 8ma to manage it? Does closing below the 8ma take you out? 1:00:20
- Besides yourself, who is your favorite Market Wizard, and why? 1:01:04
- Does the close inside the pattern define LFD, or must the whole bar, including the wick, be inside? 1:02:37
- What's your 'hunch' on silver - we hit 55 first or 65? 1:02:52
- What's the futures data showing so far versus Aksel's equity table? You told members you had 'low expectations' for the Yen H&S bottom — which patterns is the data souring you on, and has anything surprised you? 1:05:27
- Do you ever use leverage when trading crypto, or what are your general thoughts on it? I'd also like to know your perspective on alternatives to spot trading, like leveraged ETFs or leveraged tokens that don't carry liquidation risk. 1:07:27
- Would you share (export) your full list from TradingView with us? 1:10:08 - X LINK TO LIST
- What is your all-time favorite trading book, and which book has had the biggest influence on how you trade today? 1:10:27
- Peter's recommended reading list on Amazon
- Basis Points
- 3-Day Trailing Stop Rule
- Real Vision Video Series Episode One - Peter Brandt A Life In Charts