Appless Computer – Part 4: 04.12.2011
Apple is declining into support.
The poisonous wrath from the Apple Computer “fruit and nut club” continue to come my way. Here are just a couple of excerpts from the “fan” mail I have received because I suggested that AAPL might be topping out.
- “This is nonsense. Never heard of a double head. This is a bullish flag, which means the upside will be equal to its previous rising leg. STOP giving false forecast.” (Emphasis not mine.)
- “Charting[is] so 90…Hello High Freq Trading.”
I do not find these comments offensive or even irritating. I only bring them up because of the humor involved.
“Never heard of a double head.” OK, start with Edwards and Magee, 5th edition, pages 68, 69 and 76 for starters. A double head is not my invention.
“Charting [is] so 90s.” Well, with this in mind let me comment on the chart of AAPL.
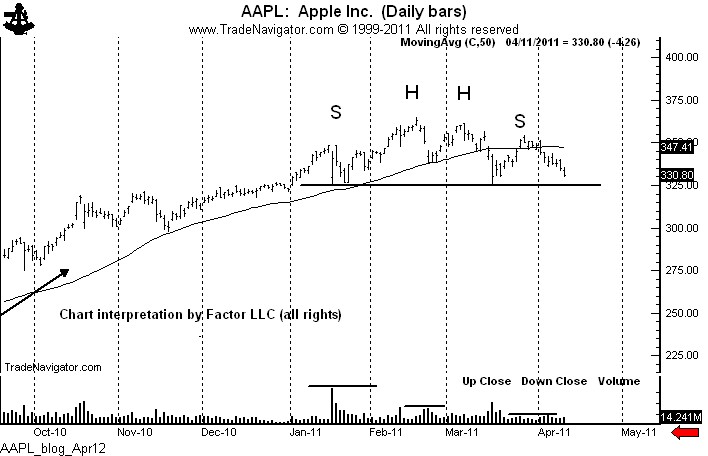
The decline on Monday (the 10th down day in 11 days — not exactly a show of strength) has brought prices closer to the critical neckline of the 3-month H&S top. It is show time! The market is NOT oversold, yet I must emphasize that AAPL has NOT completed a top and until it does the trend must be viewed as being UP, not down. The neckline at around 224.50 (+/- 2) will be a magnet for prices.
A decisive close below 320.50 will be the kiss of death for AAPL, and will set up a target of 280 to 285. But if the market can hold above 320, turn back up, spend a full day above the neckline and then advance over 342, a major chart buy signal will set up. Until then I assume that the H&S top will become a reality.
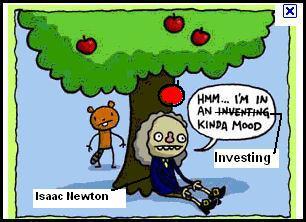
I am short. I have moved stops to 335.81 and 340.27. My risk is presently about 38 basis points. I plan to cover some shorts today if the market opens lower and holds. I would then put the shorts back on if a rally develops. But, if the market opens lower and cannot fill the subsequent gap in the days ahead, my advice to Isaac Newton is… “Duck!”
BTW, there is an upside gap on the chart at 323.48 from Dec. 31. The market may be attempting to fill this gap. Or, the market may gap below the neckline and form an “area island top”….which, of course, like the double head, is also a chart formation I am just making up.


Leave a Reply
Want to join the discussion?Feel free to contribute!