
Bottom in Precious Metals???
There are some signs that the 4-plus year bear trend in the precious metal markets is coming to an end
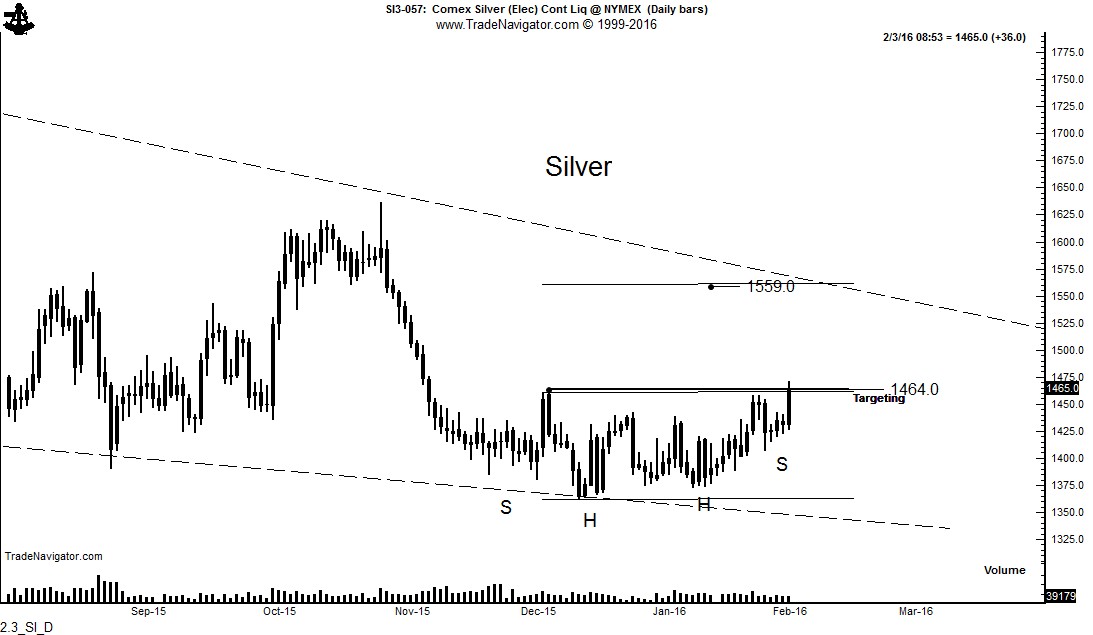
As I have pointed out always constantly, I hate trading Silver. Silver can move $1 one way or the other and mean nothing technically. Gold is a technically honest market, and usually the leader. All things being equal, I would much prefer to trade Gold rather than Silver.
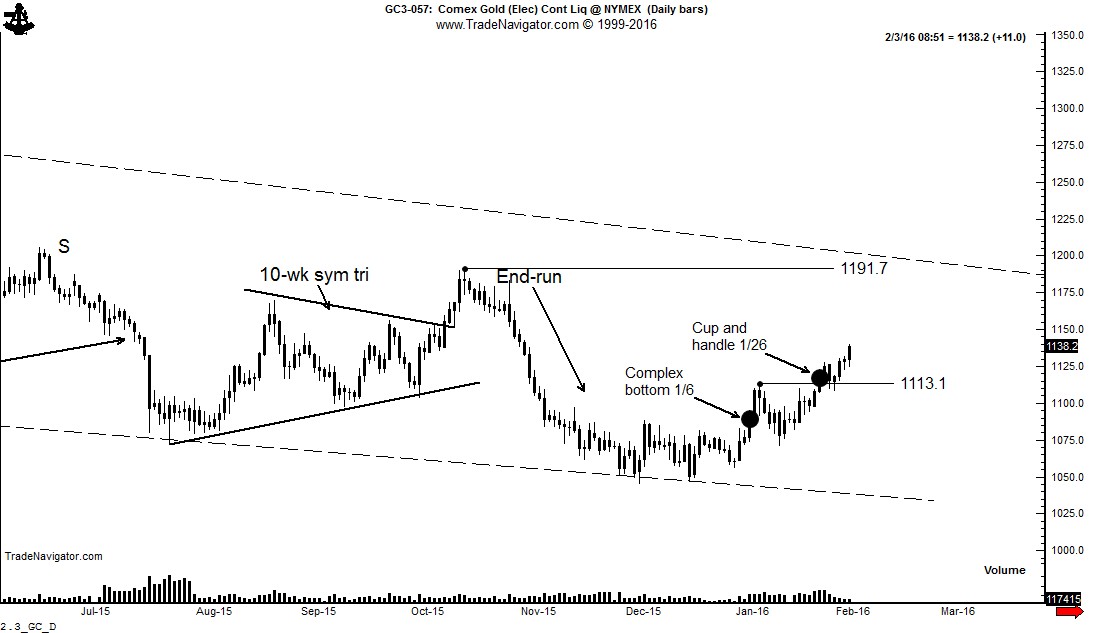
Gold completed a small compound bottom on Jan 6 and an 11-week cup and handle pattern on Jan 26. Gold has developed very few possible bottom patterns on the daily chart all the way down from the 2011 high. An attempt to complete a symmetrical triangle bottom in Oct 2015 resulted in a classic “end-run.”
In more than three years the Gold market has not experienced a single daily chart bottom that has fulfilled the implied price move. This does not surprise me given Gold’s sustained bear trend. If Gold can rally to 1180 to 1190, it will be the first constructive daily chart configuration to reach its target in several years.
Similarly, Silver has also not completed a successful daily chart bottom in several years. The daily Silver chart intrigues me. The daily chart has been trying to bottom for the past several weeks. The chart now exhibits a possible H&S bottom — with two heads and an abbreviated right shoulder. A convincing close above 1470 is required to complete this bottom pattern. The target would be 1559.
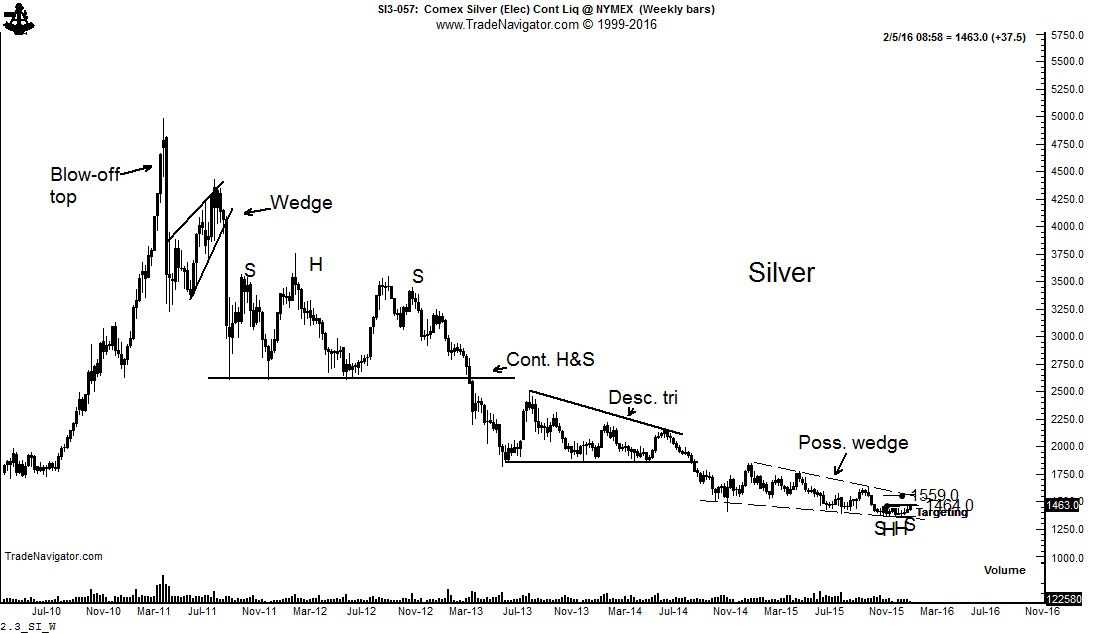
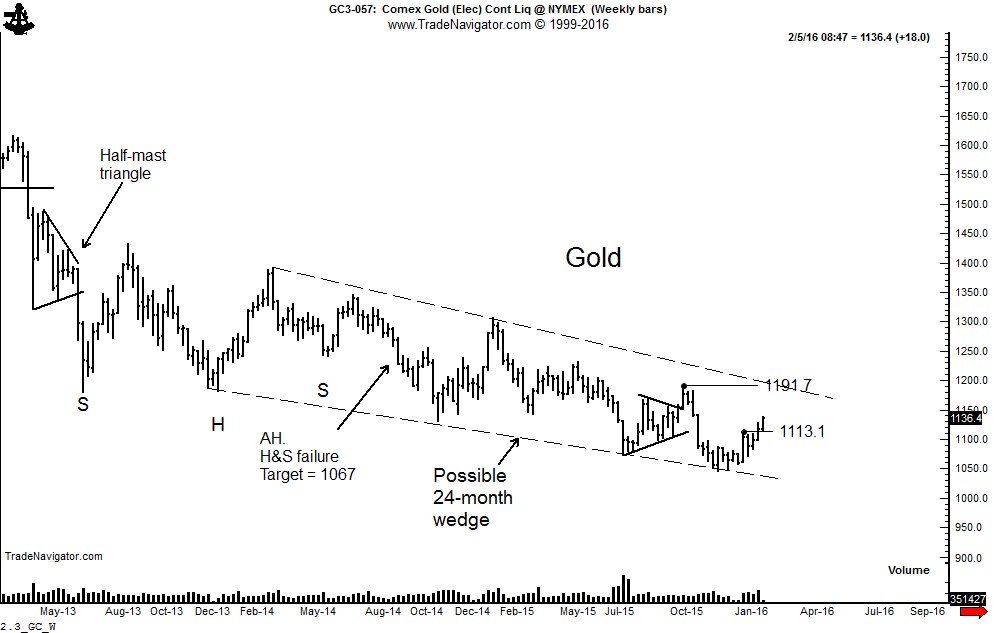
Of note is the fact that the weekly charts in Gold and Silver are forming falling wedge patterns. The wedge in Silver has better definition than the wedge in Gold. I must emphasize that the wedge is a diagonal pattern — and diagonal patterns are very unreliable. It should also be noted that falling wedge bottoms typically back and fill for months — often times retesting the apex of the triangle before a genuine bull trend gets started. Nevertheless, these wedges are worth monitoring.
It should be noted that the completion and fulfillment of up-trending daily chart patterns does NOT equal the onset of a new bull trend. Yet, it could be the start of building a more permanent bottom.
I conclude with a repeat of this thought: No daily chart pattern in Gold or Silver has been successful since the 2011/2012 tops. The burden of proof on the patterns above rests with the bulls. Time will tell if at last a daily chart pattern can reach a target before rolling over.
plb
Key words: Gold, Silver
$SI_F, $GC_F. $SLV, $GLD


