
One Year Later: GE, Classical Charting, and Avoiding Dead Money
One year ago, July 2024 – ChartWizards Report #53 highlighted General Electric (GE) at $150 per share, breaking out from a 25 year range and with a price target more than 30% higher. That move just happened.
Report #53, July 2024
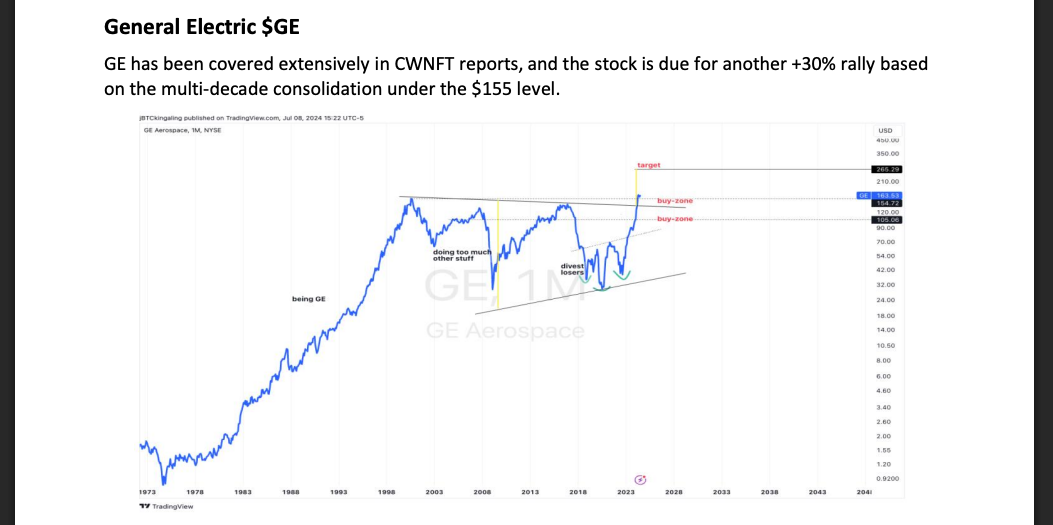
The chart told the story:
-
G.E. was one of the first twelve companies to go public on the U.S. Dow Jones Index, in the late 1800s
-
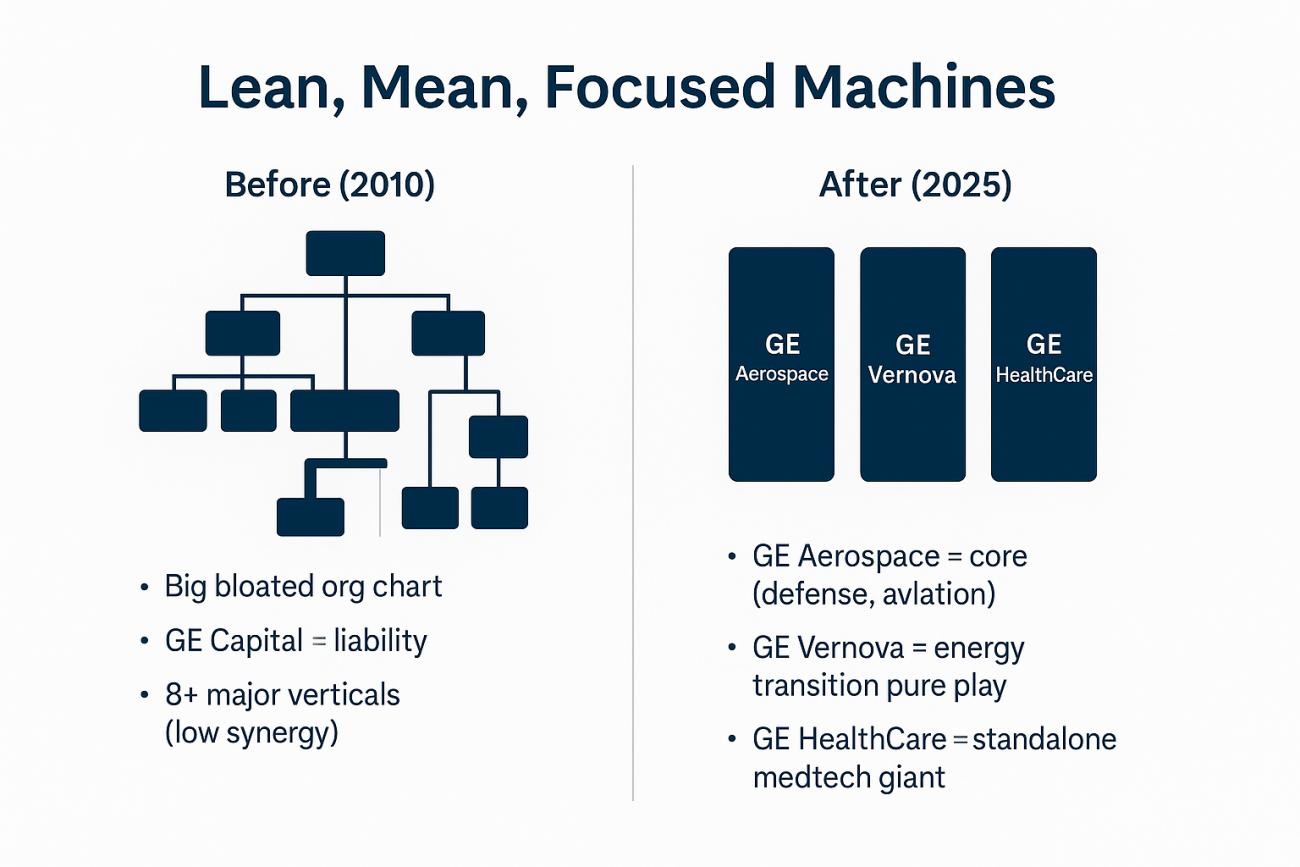
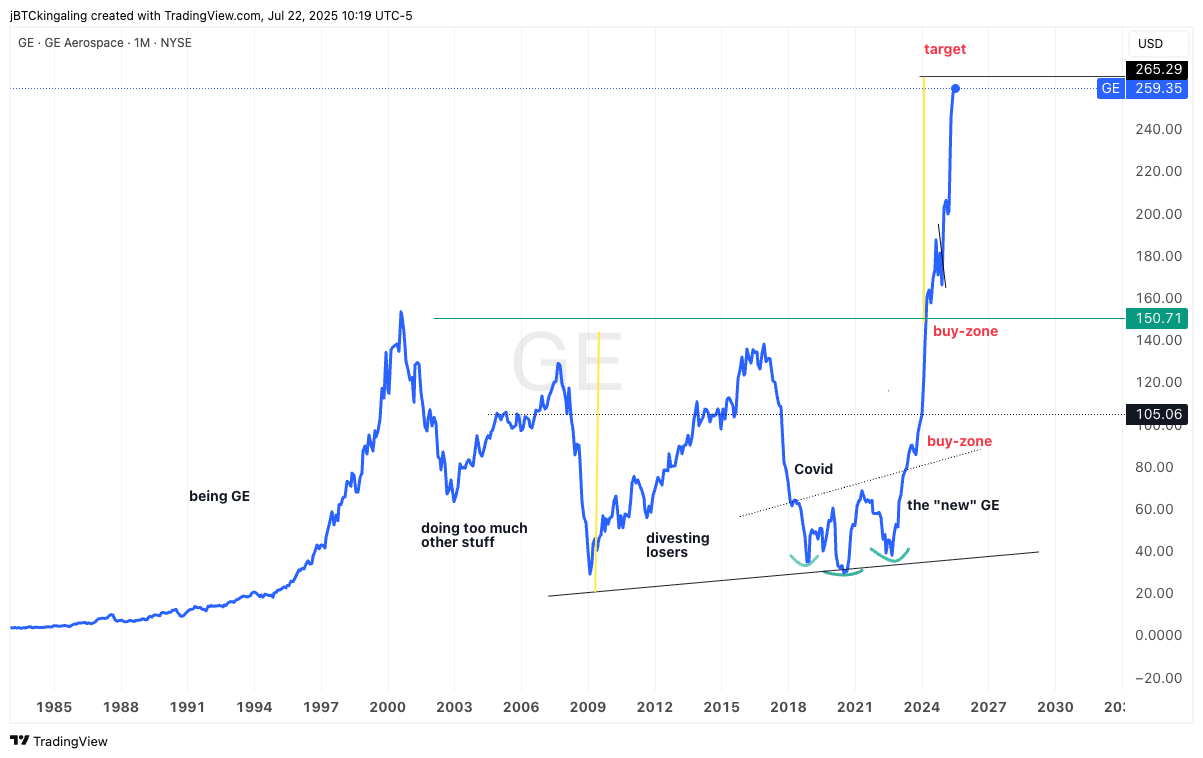
It became an American blue chip, but G.E. peaked in 1999 and spent the next two decades in decline; “doing too much”, diversifying into mediocrity.
-
Post-2020, we saw an inverted Head and Shoulders bottom nested within a broader structural pivot – the company was divesting losers, leaning back into core aerospace.
-
The breakout above ~$150 was clear, decisive, and confirmed on both log and arithmetic charts (see Report #53, July 2024)
-
The measured move objective of ~$260 was derived from Edwards & Magee-style target projection using the depth of the pattern
Here’s the General Electric chart today – target reached at $265.
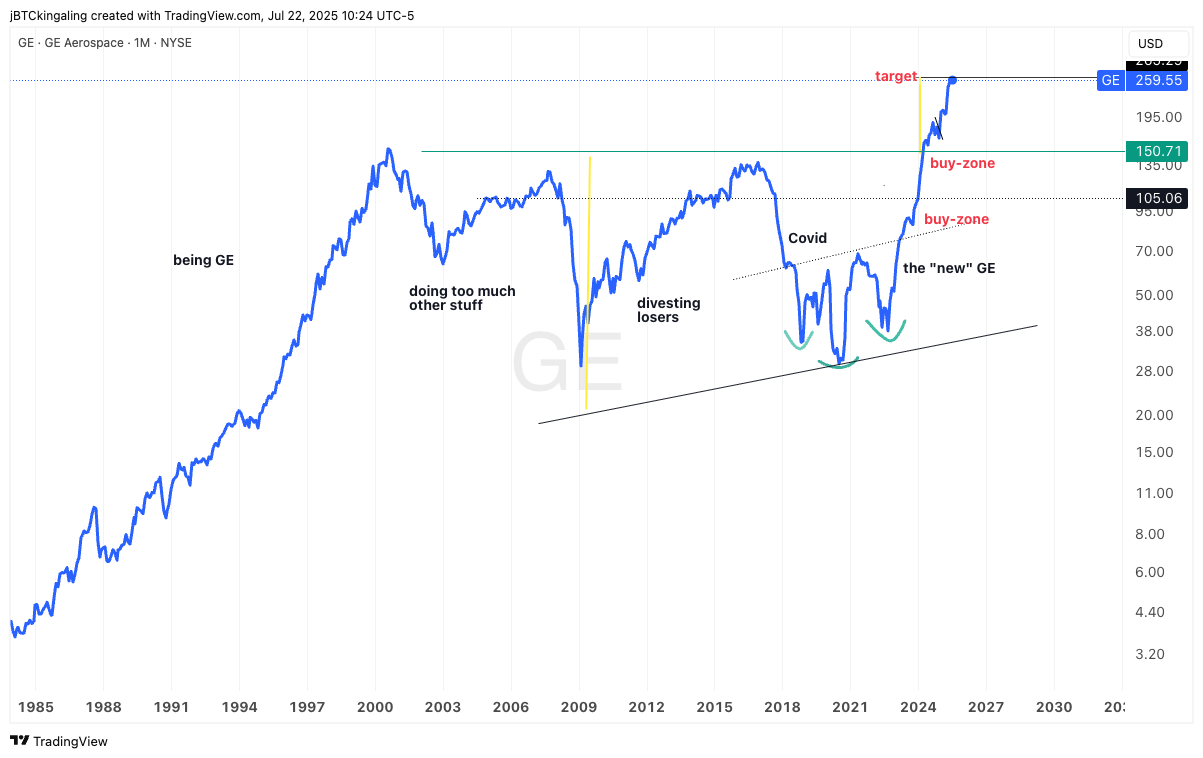
The log chart looks as if the move from $150 to $265 isn’t huge, but it is!
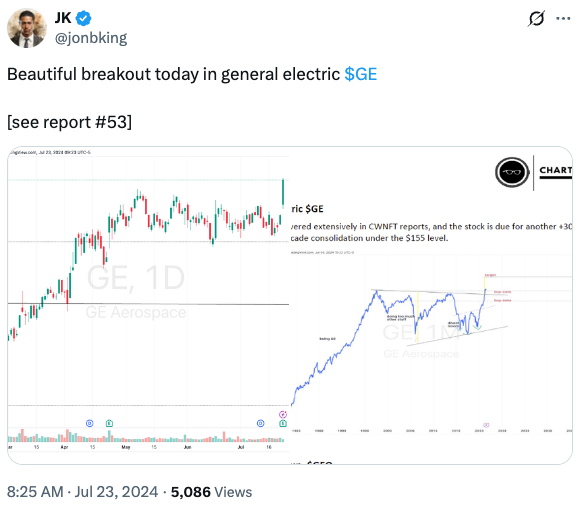
HAPPY 1-YEAR ANNIVERSARY: X post, July 23, 2024
The Alpha of Avoiding Drag Money
The real alpha in avoiding GE’s 20-year sideways slog (2000–2020) was opportunity cost management. Here’s how I think about it:
1. GE paid dividends, yes, but at what cost?
From 2000 to 2020, GE:
-
Lost 75%+ of its peak market cap 😱
-
Flatlined while the S&P 500 tripled 😩
-
Burned two decades of investor “patience” ⏳
Avoiding this sinkhole means your capital was free to ride Apple, Amazon, Tesla, ten years of Bitcoin, or any of the other 10x moves in energy, cloud, semis, or healthcare. That’s the alpha of trend following, classical charting techniques, and risk management.
I will NEVER hold a position that digs into my pocket and/or drags down my returns.
2. The GE Trade Was Inevitable
The range was long. The breakout was obvious. The post-split restructuring was public. You didn’t have to guess the bottom. You could have read Report #53 while drinking your coffee on a Saturday, and still caught the entire move.
This is enhanced participation, that is avoiding the drag without missing the meat of the move.
3. Emotional & Cognitive Alpha
Avoiding GE during the dead years was financially beneficial, but it also kept your mental capital fresh and ready for better setups.
In nailing this breakout, we dodged two decades of drawdown disguised as dividend yield. A masterclass in discretion and discipline.
Traditional financial advisors will not give you this edge. They are trained to avoid specificity and hedge their views – speaking in abstractions instead of clean, well-defined setups with asymmetric risk and reward. They don’t say “30-50% upside.” They say “potential for long-term growth.” That’s the difference between asset gathering and actual trading.
At Factor Research, and in ChartWizards reports, trading education is based on the charting principles of Peter Brandt, rooted in the techniques of Edwards, Magee, and Schabacker. No noise, no hype, just disciplined risk management combined with decades of pattern recognition.
-
Clean technical setups
-
Macro and structural context (GE’s transformation)
-
Precise risk-reward framing
That’s what made this GE trade possible.
This is why ChartWizards Reports exist. Sign up here if you haven’t – this is the last month to lock in Year 1 pricing:
The entire Report #54 from AUGUST 2024 is pasted below. Its insightful for me to read what I was thinking this time last year, examining where prices were, where my P&L was, where Bitcoin was, etc., and I encourage other traders to maintain their records in a similar way.
This is my third “thought piece” for July 2025, so my apologies for feeling “wordy”, and thank you for reading.
Trade safely.
#jk
 Loading...


