Tag Archive for: NQ_F

The chart case for a bear market in U.S. equities


All major U.S. stock indexes are forming potential tops

A case can be made based on classical charting principles that the current decline in the U.S. equity markets is just phase one of a larger price decline -- in other words, that 
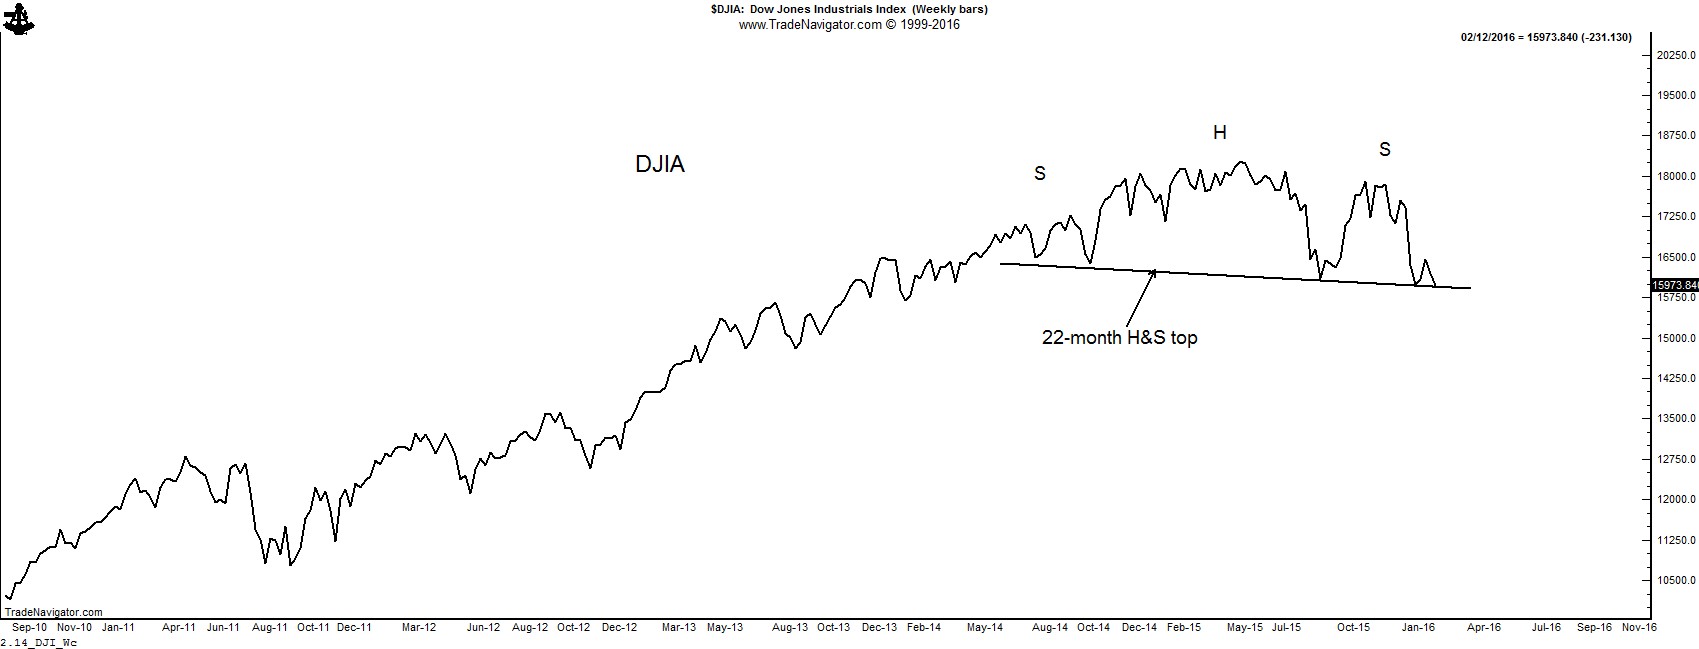
U.S. stocks are in a bear market. Consider the following. Factor believes that the most significant price of the day is the closing price and the most signficant price of the week is Friday's closing price. The weekly closing price chart of the DJIA displays a possible H&S top pattern. This top has not yet been completed, but a Friday close below 15,800 would do so. 2.14_DJI_Wc Read More

Some shorter-term charts that are ready to move

This content is for members only

Many great looking charts

This content is for members only

The technical case for another advance in the Nasdaq index

This content is for members only

Nasdaq set up for a major buy signal

This content is for members only

Analog indicates higher Nasdaq prices

This content is for members only

A more in depth look at the stock indexes — how bullish is bullish?

This content is for members only

Lessons from seven weeks of stock market chop

This content is for members only

Three very sexy price charts

This content is for members only