
The chart case for a bear market in U.S. equities
All major U.S. stock indexes are forming potential tops
A case can be made based on classical charting principles that the current decline in the U.S. equity markets is just phase one of a larger price decline — in other words, that U.S. stocks are in a bear market. Consider the following.
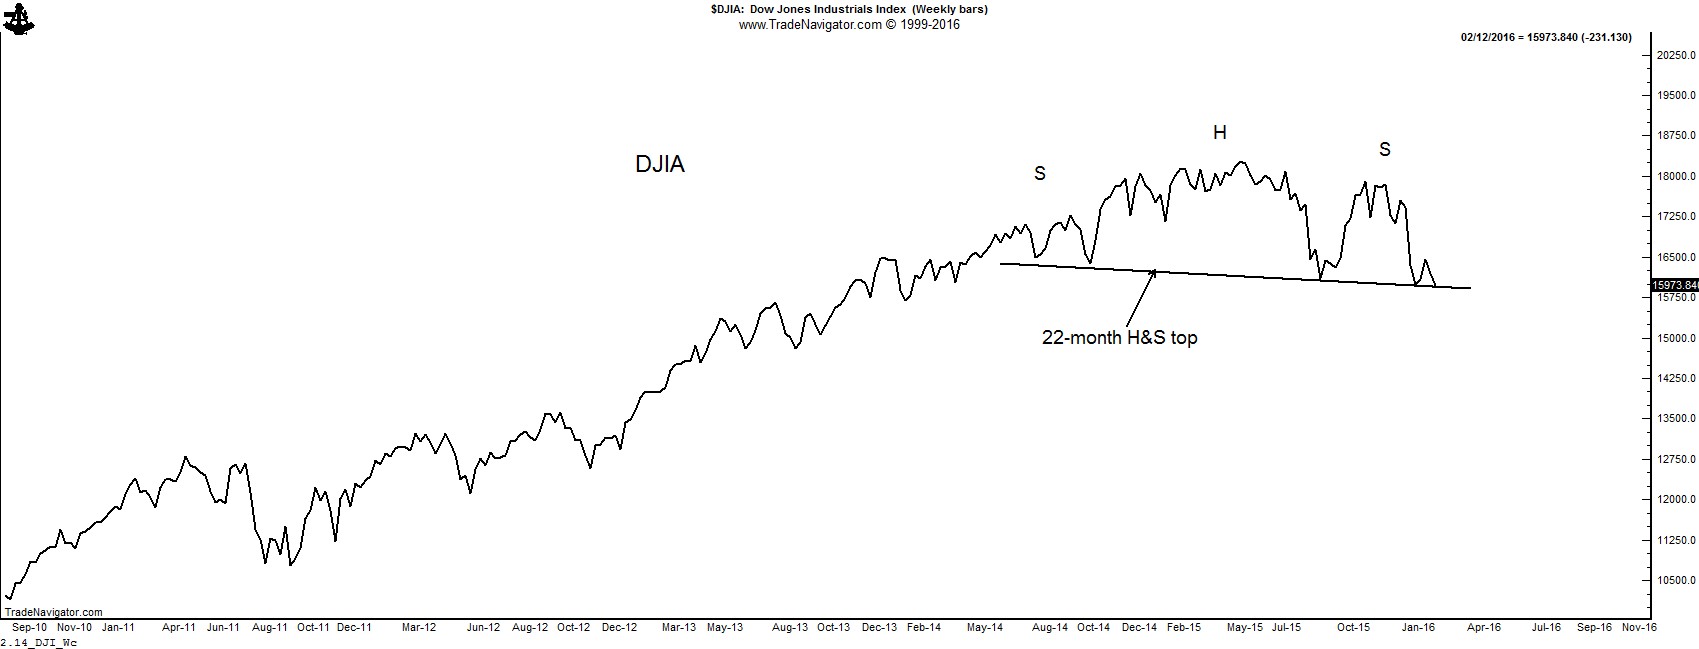
Factor believes that the most significant price of the day is the closing price and the most signficant price of the week is Friday’s closing price. The weekly closing price chart of the DJIA displays a possible H&S top pattern. This top has not yet been completed, but a Friday close below 15,800 would do so.
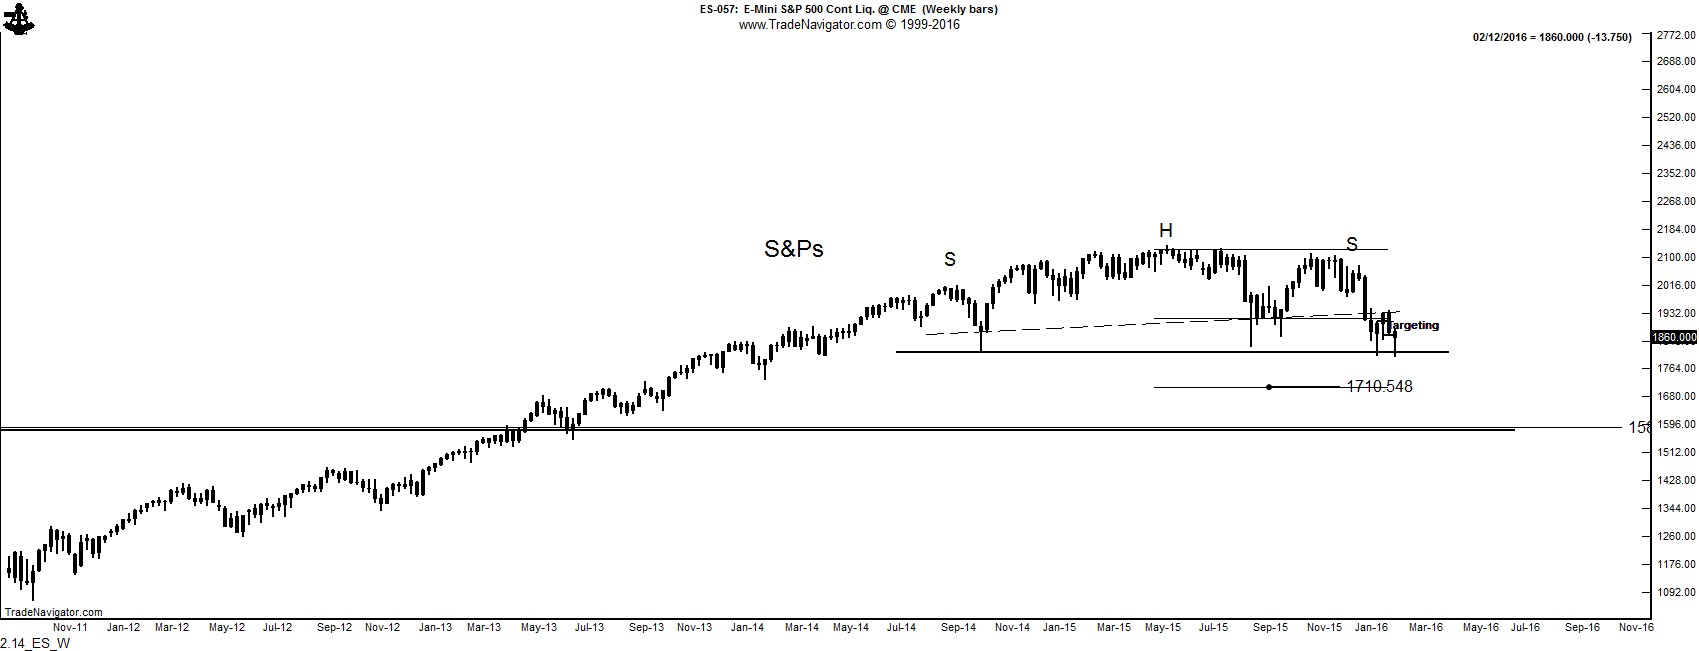
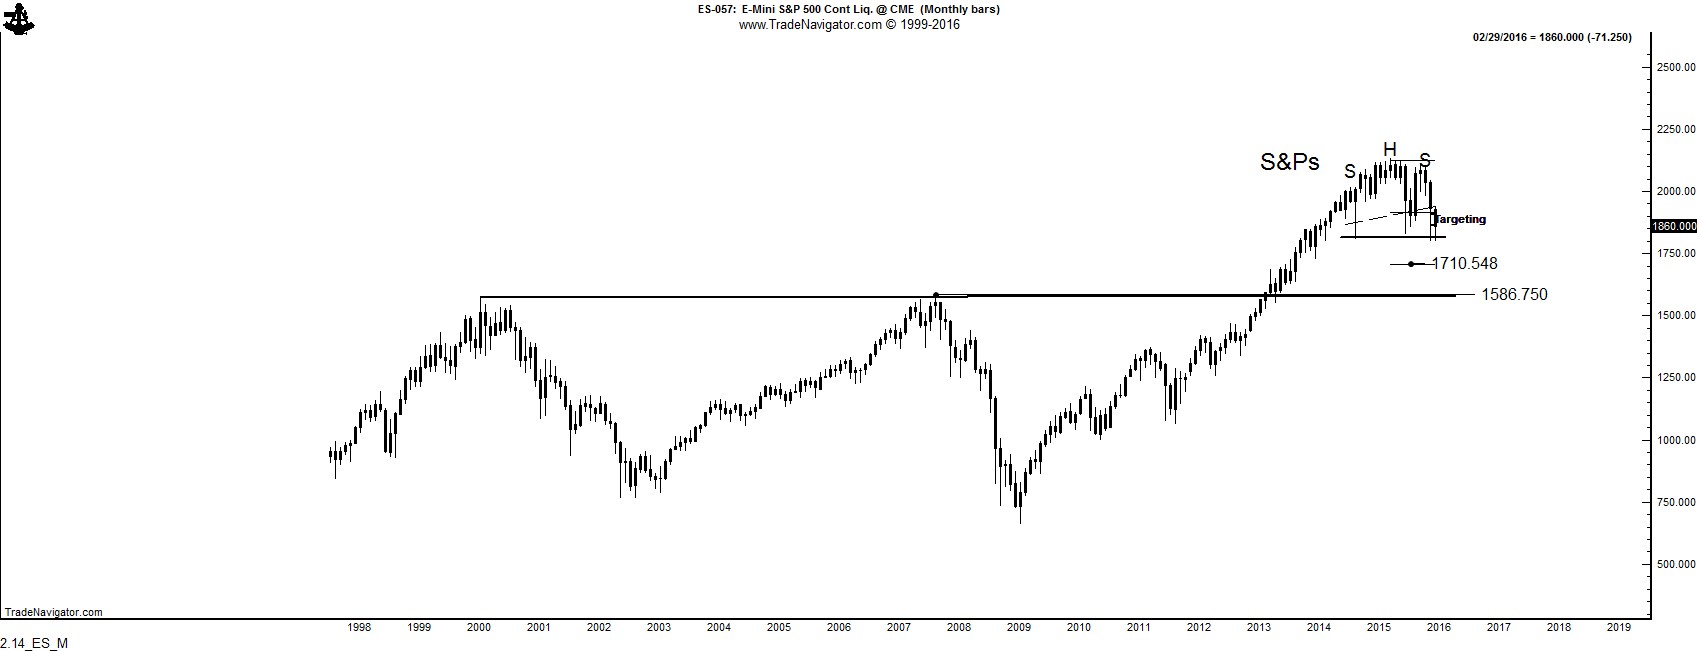
The weekly closing chart of the S&Ps has already completed and retested the underbelly of a H&S top, as shown by the dashed line on the first chart below. However, the weekly bar chart is resting on the horizontal neckline. A decisive close below last week’s low would complete the H&S on the weekly bar chart. The weekly closing price chart has a downside profit targt of 1710. A decline below 1600 would simply be a retest of the major breakout in 2013 on the monthly chart (second chart below).
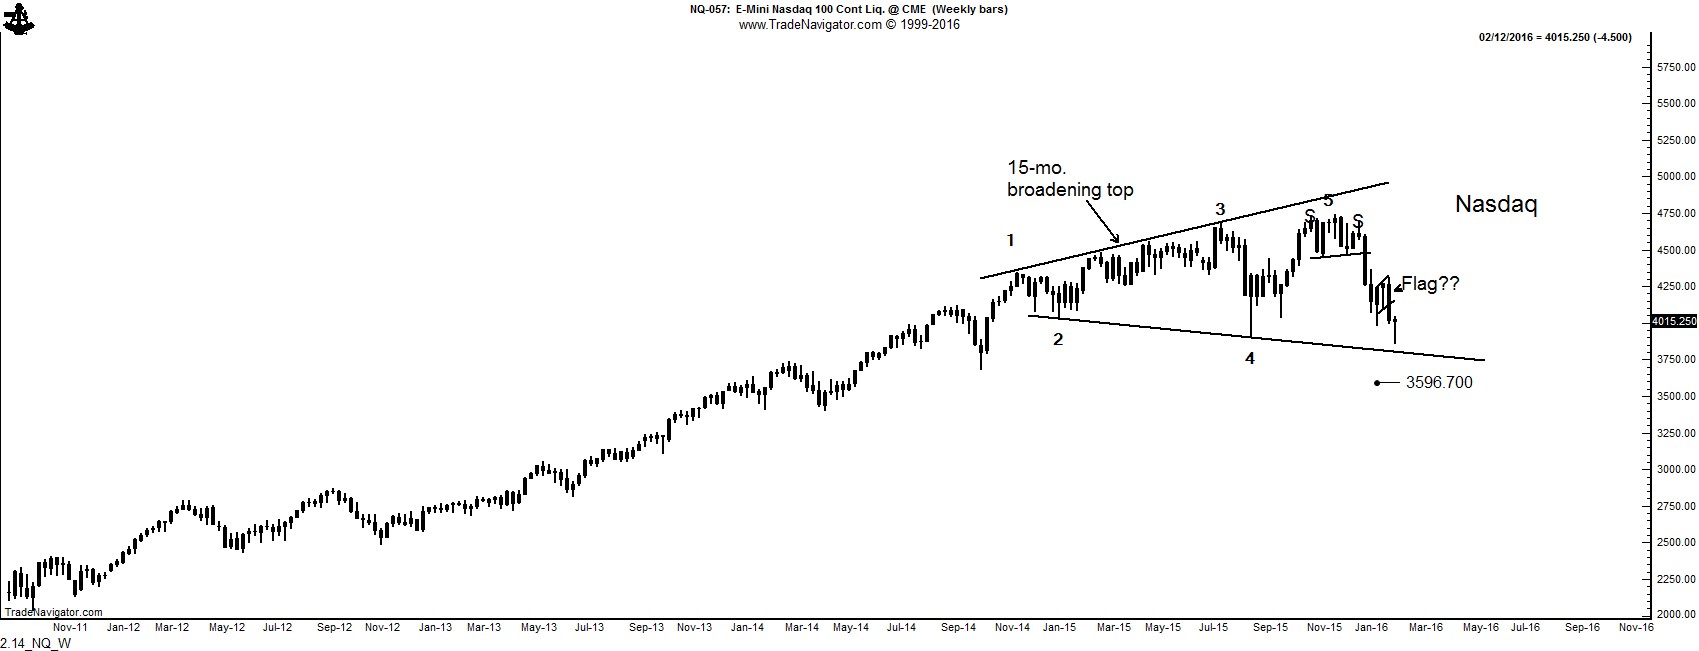
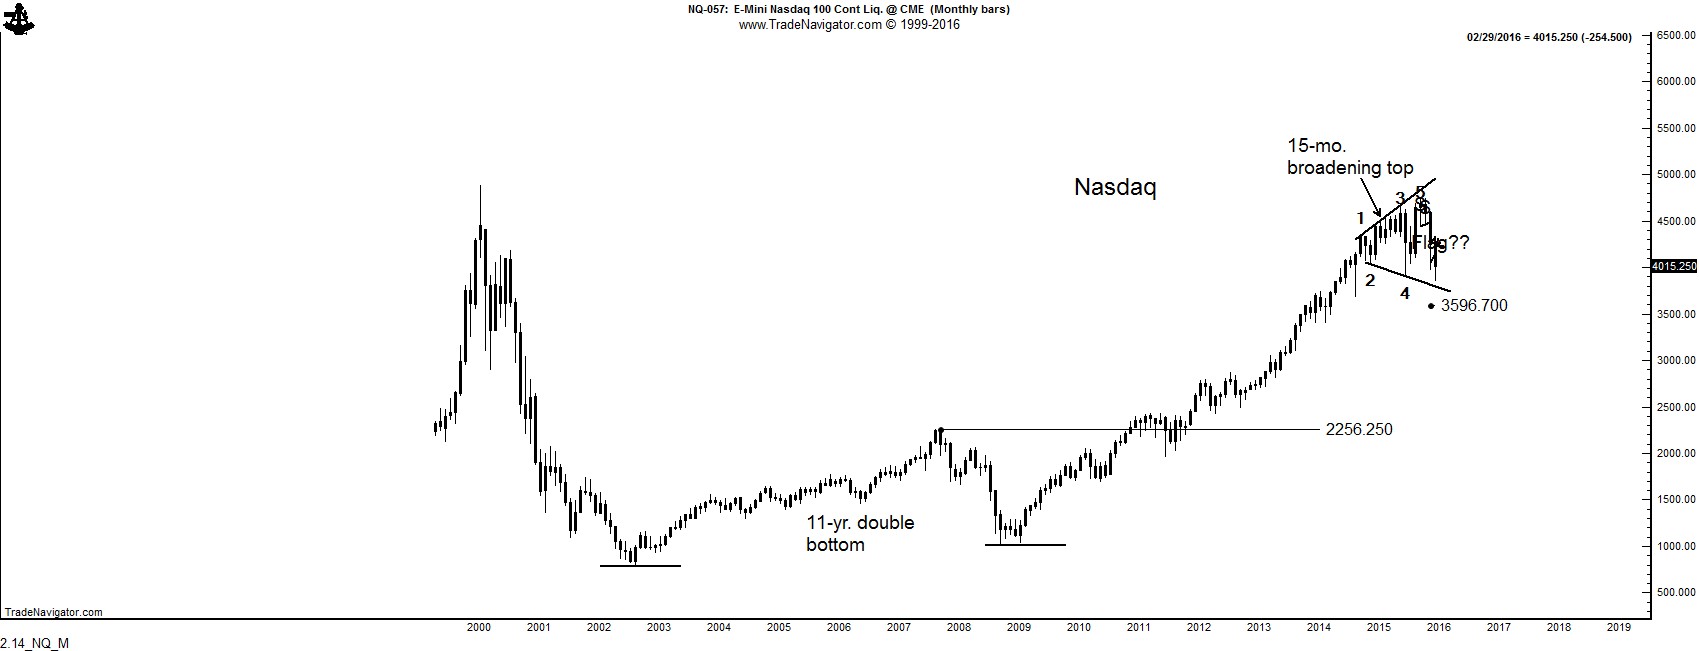
Finally, the weekly chart of the Nasdaq 100 if forming a rare broadening top pattern. The monthly graph (second chart below) shows the magnitude of the bull market in the Nasdaq in recent years. In fact, the Nasdaq advanced 4.5-fold from the 2008 low. The stock market bulls are owes nothing after an advance of this magnitude.
Note: There is a cavaet to the H&S top interpretation in the U.S. stock market. Classical H&S tops generally carry the heaviest volume on the left shoulder or head with light volume on the right shoulder. This volume profile is not the case with the H&S top patterns as shown above. This fact gives me pause with regards to proclaiming a bear trend in U.S. stocks. Nevertheless, price is always king — and kings rule over volume.
Many stock market followers consider a 10%+ decline to represent a bear market. The Factor considers a 10% decline to be a simple correction within a bullish trend. Factor considers a 25% to 35% correction to be a bear trend. Typically such corrections last 18 or so months. The Factor believes that the current decline has further to go in magnitude and duration.
Membership to the Factor research service is presently closed. Membership will reopen in April. For further information, click here.
#DJIA, $ES_F, $SPY, $YM_F, $QQQ, $NQ_F
plb
###


