The Apple (AAPL) is falling from the tree – Chart Review: 04.06.2011
Is the Apple about to take a fall from the tree?
Summary
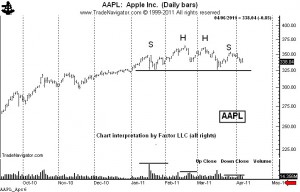
There are chart patterns…then there are textbook chart patterns. Presently Apple Computer (AAPL) is forming a head and shoulders top that could go into the textbooks as an example of classical charting principles.
The daily chart of AAPL exhibits a near-perfect example of the H&S pattern. Several aspects of this chart are worthy of note.
- The pattern actually has a double head. This adds to the bearish potential of the pattern.
- The decline since the March 28 high (the high of the right shoulder) has taken place against the backdrop of new highs in most of the major stock indexes.
- The neckline is nearly flat. Horizontal necklines add reliability to a H&S pattern.
- The volume profile is straight out the Edwards and Mage (and Schabacker) textbooks. Note the heavy volume on the left shoulder, slightly less volume throughout the head, and finally light volume in the right shoulder, particularly during the mid- to-late March rally. This volume profile is a classic example of price distribution – shares moving from stong hands to weak hands.
It is important to understand that this pattern has NOT yet been completed. This is a chance this pattern could fail to materialize. Chart patterns are most useful as trading tools, not for making price forecasts. Short positions established at current levels could be protected using the March 28 high at 354.32. A decisive close above the existing right shoulder high would largely negate this H&S interpretation.
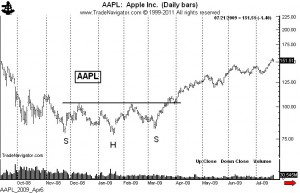
A close below 320 would complete the H&S top. Is must be remembered that the H&S pattern indicates a change in the primary trend and can carry prices far beyond the measured move. I have included a chart of the H&S bottom for Apple computer completed in 2009 prior to this incredible bull trend.
My game plan is to wait for a breakout and then risk about 150 basis points on a short position, or one and one-half percent of trading capital. The Apple may stay on the tree and ripe some more, but a strong wind could end this apple’s growing season.
###


Trackbacks & Pingbacks
[…] details of my shorting campaign – mainly motivated by all the hate messages I received from my initial AAPL posting, then the post that laid out a trading strategy to risk 75 basis points (3/4 of 1%) to make 1420 […]
Leave a Reply
Want to join the discussion?Feel free to contribute!