
To take advantage of our new Factor Report sale, please visit the offer page here >>> https://www.peterlbrandt.com/
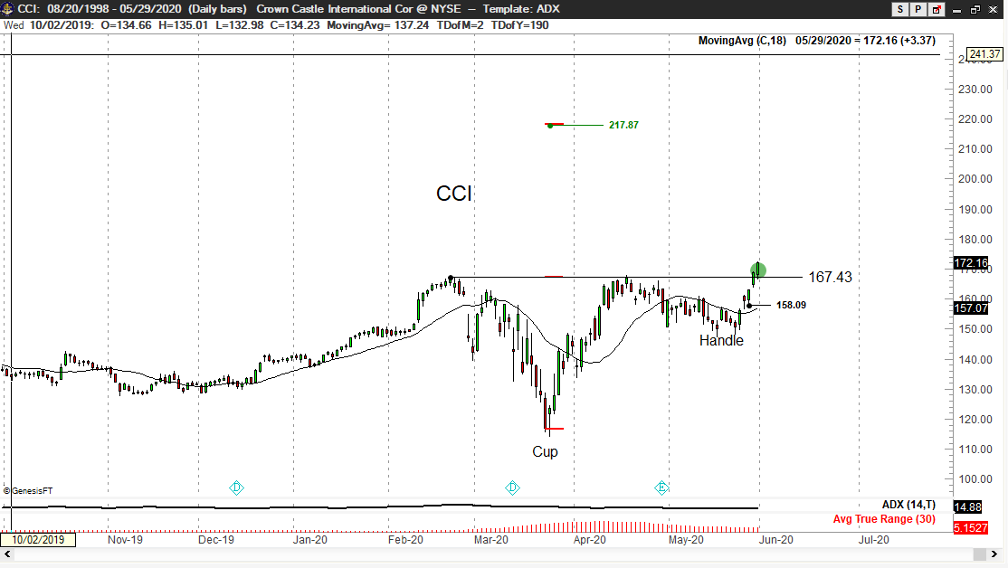
Crown Castle International (CCI)
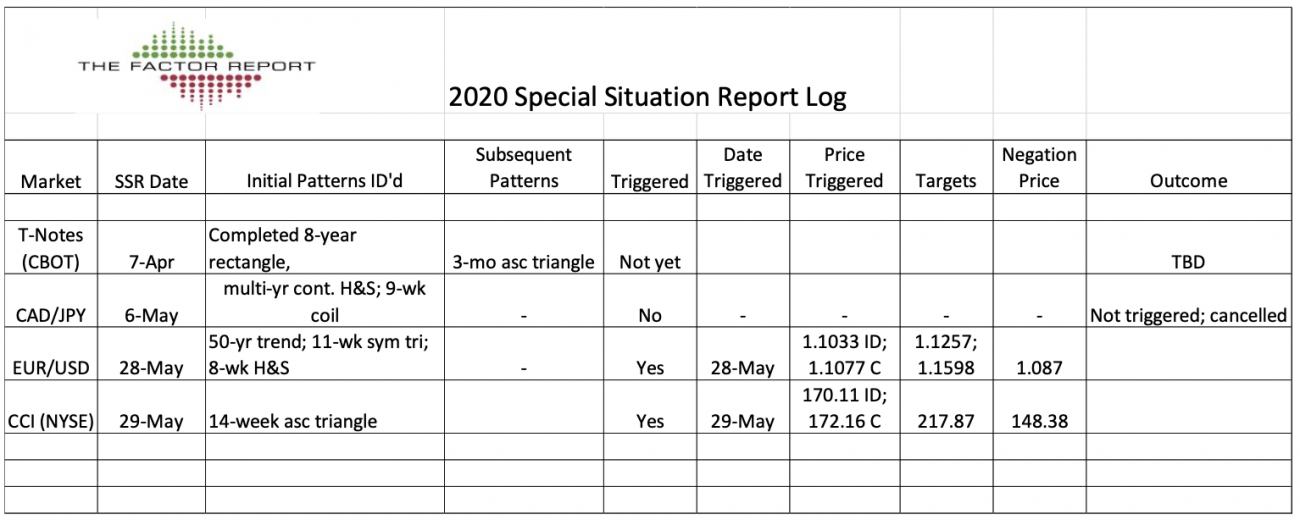
This stock has experienced a spectacular bull trend for many years. The daily and weekly charts display a 14-week Cup and Handle pattern, arguably completed on May 29. One more higher close will confirm this bullish chart construct. Longs in this stock could be defended below the May 21 low of 148.38, the May 27 low of 158.09 or in relationship to the 18 DMA.
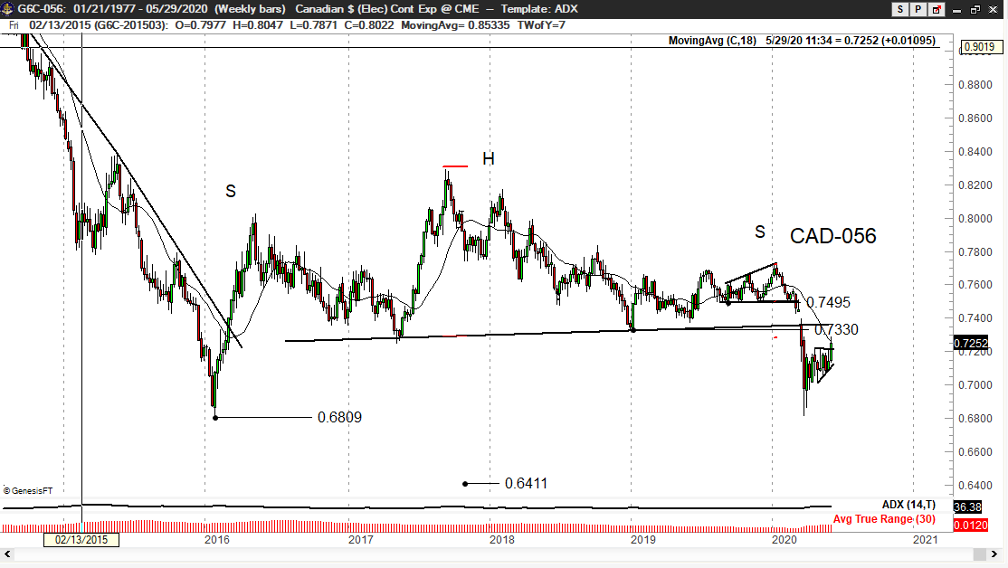
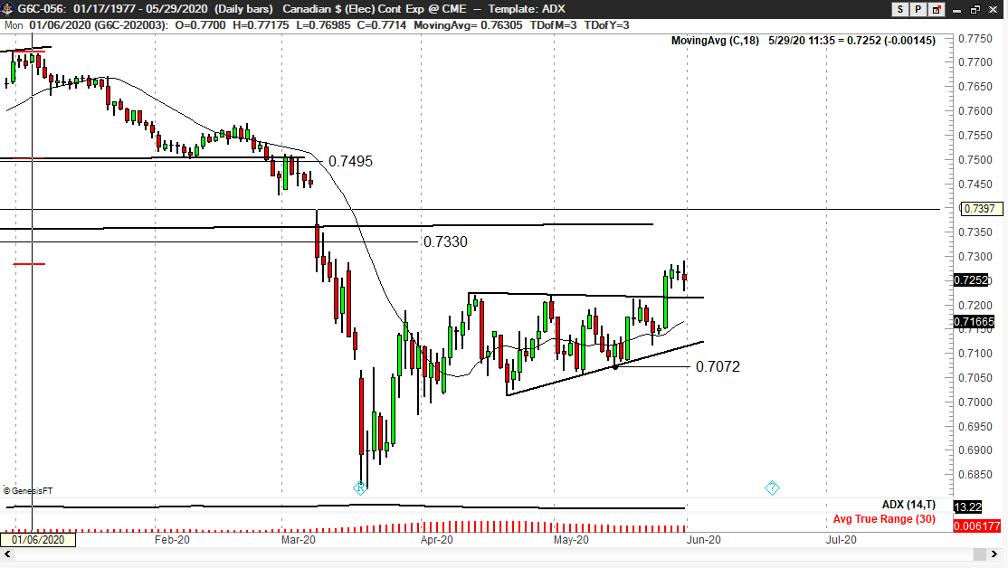
Canadian Dollar – SSR Pending
I continue to believe that the 4+ year H&S pattern on the monthly weekly chart is a valid interpretation. The market could simply be in the process of retesting the neckline of the H&S pattern at .7330. I will be monitoring the daily chart for an indication that the rally is complete, and will issue a SSR accordingly. One possibility is that a decline below .7072 would be an “end-around” the symmetrical triangle.
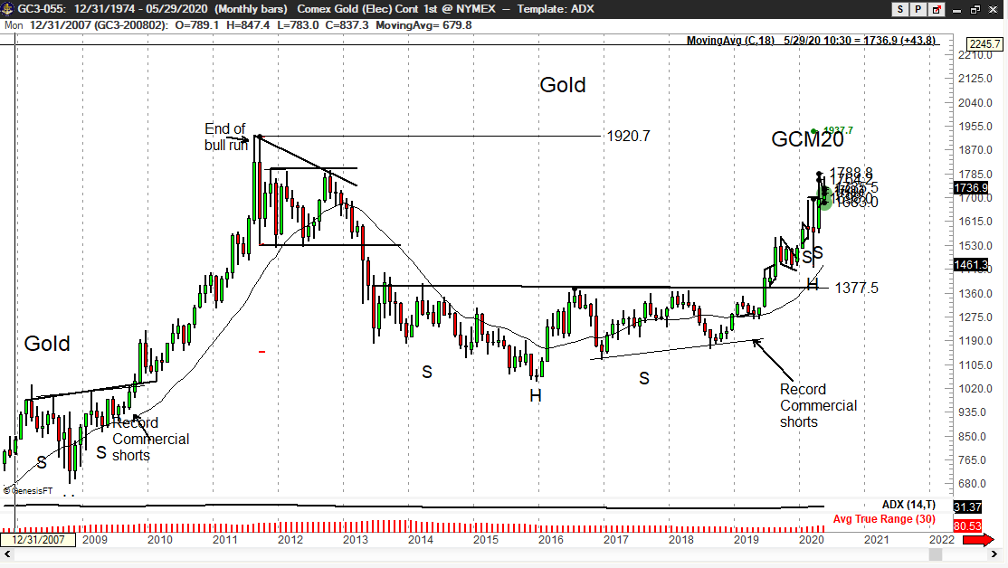
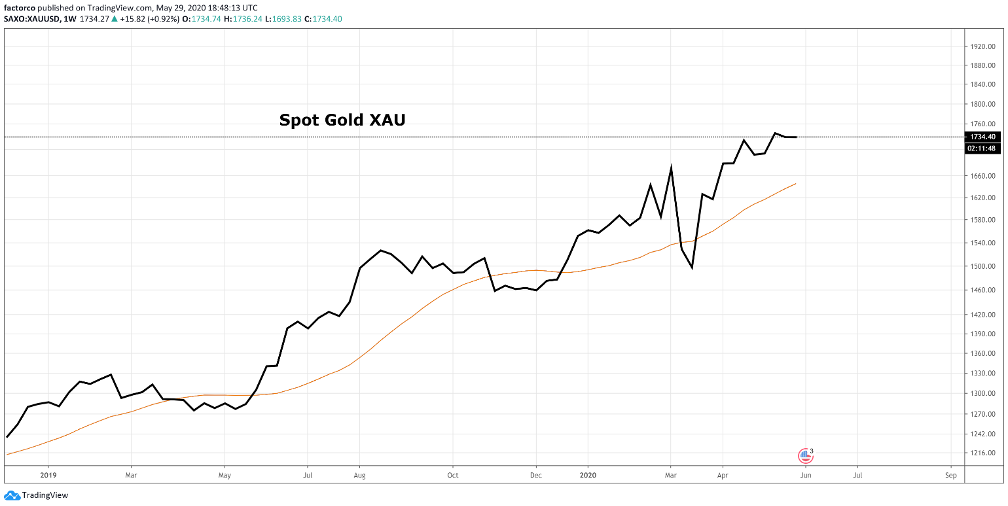
Gold – SSR Pending
Ugh! I feel like I have been in the spin cycle with this market. The breakout of the massive inverted H&S bottom on the monthly chart was an easy trade. In fact, Gold was a wonderful example of classical charting principles until the COVID-19 decline in Mar. Gold has been a difficult trade since.
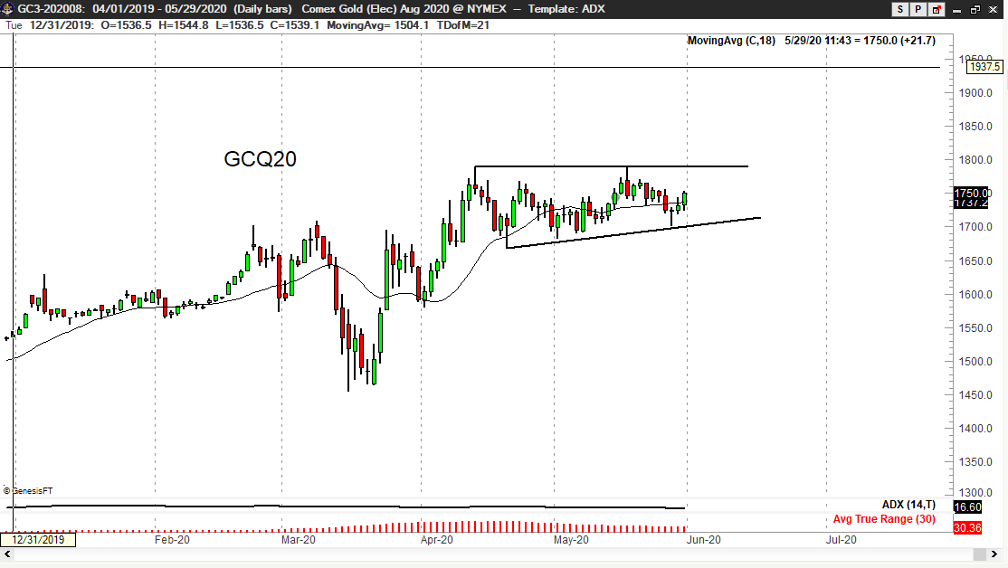
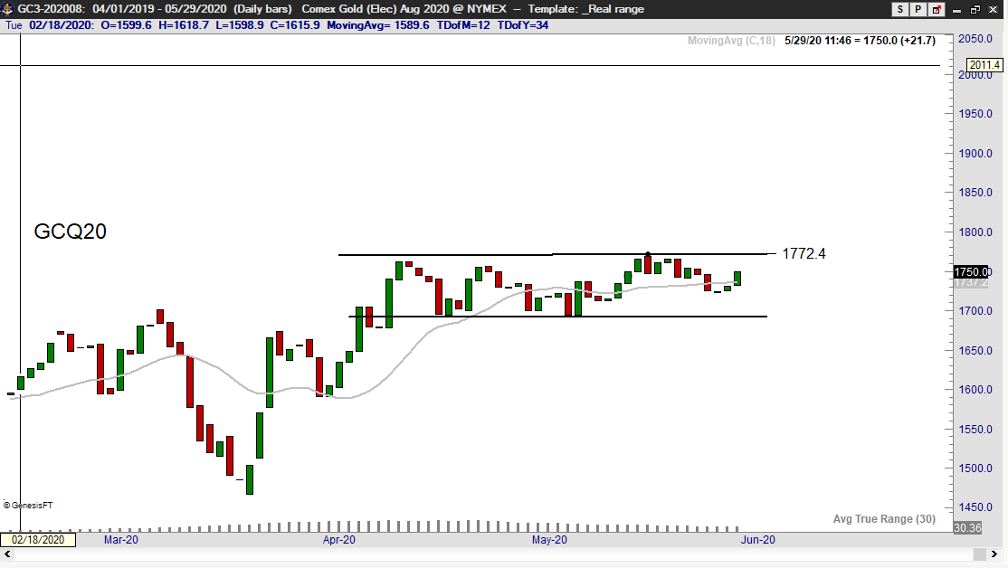
I continue to believe Gold is going higher – much higher. Yet, I feel a little snake-bitten by the market. The daily chart of the Aug contract displays a possible ascending triangle. The Real Range chart displays a continuation rectangle pattern in greater clarity, whereby a decisive close (25% to 50% of ATR) above 1772 would be a buy signal. Most impressive to me is the steady uptrend in spot (physical) Gold.
Editorial comment about the Special Situation Report concept
Special Situation Report trades are those that I believe offer the opportunity for a longer hold time. Yet, the expectation of “specialness” by Factor members is an aspect of the Special Situation Report concept that I do not like. In my world of trading, a trade is a trade is a trade. A trade is nothing more than a datum point in a series of data points subject to random probability sequencing.
Right now, I am pigeon-holed with the Special Situation Report concept, but I am exploring other ways to alert you to trading opportunities that do not carry with them higher expectations.
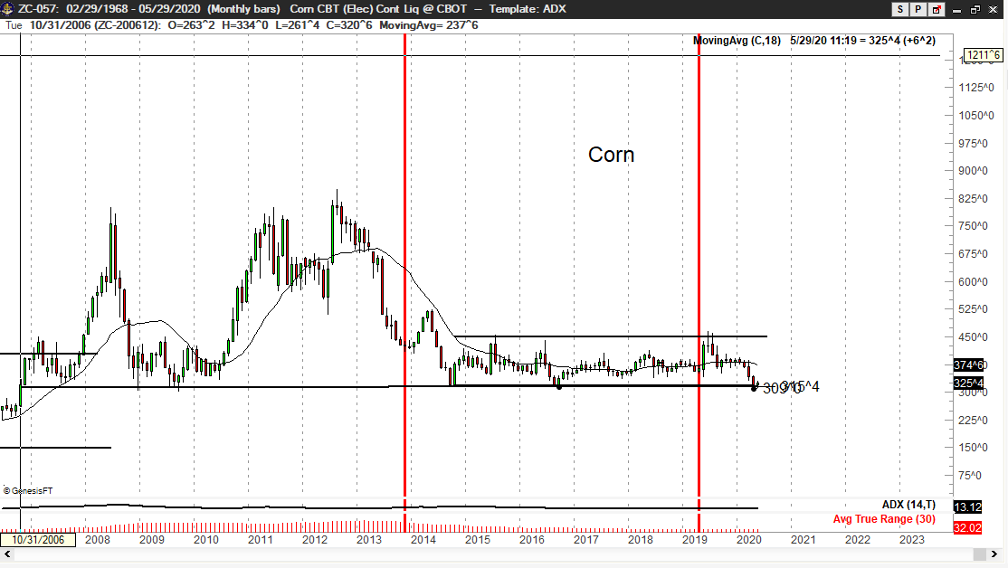
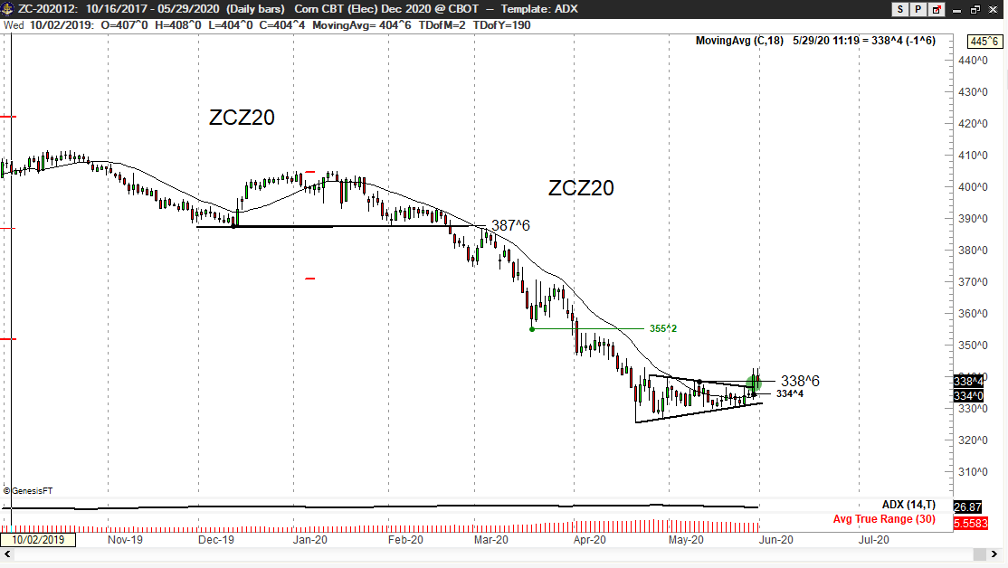
Other Charts of Interest (as of this date) that might offer swing trading opportunities Corn
Strong historical support on the monthly graph, which also displays a 6-year rectangle. There is near-record commercial long positioning. A symmetrical triangle has formed in the Dec contract.
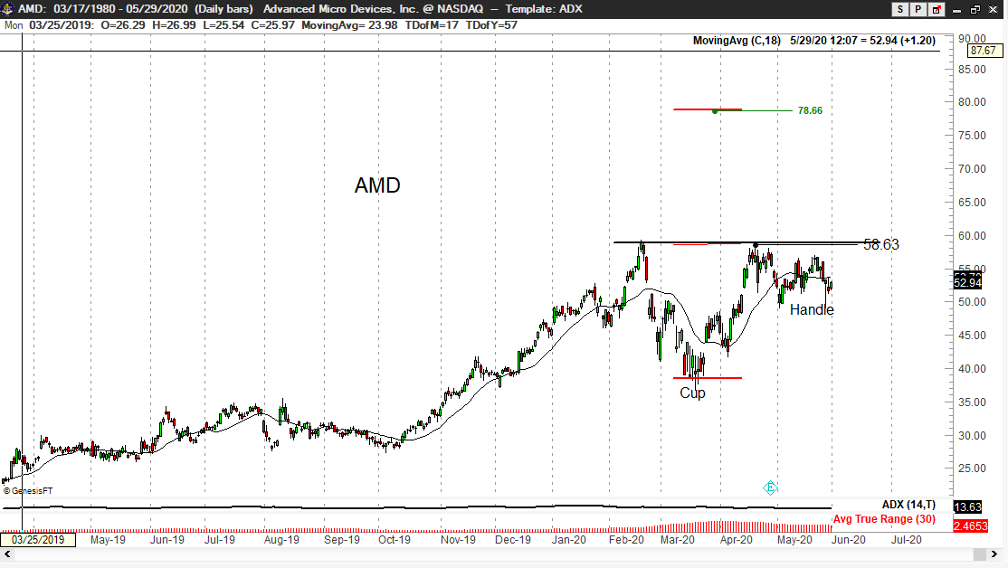
AMD (NASDAQ)
2020 Special Situation Report Log
See ongoing postings on the @factor_members private Twitter feed (simulcast on the Factor Member website). Steps for access.
Spotlight Tweets – Factor Member Private Twitter
Are you following our private Twitter? Steps for access
From our Content Library
A Life in Charts – Episode One
Spotlight Links
- The Factor Report, May 29, 2020 Week Ending Wrap Up and Q&A – video
- Real Vision video series with Peter – five videos
- Meaningful Schabacker quotes from Factor Members on Member Twitter
PDF Version


