
The 3 Most Important Ways to Track Trading Performance
Trading Performance
Human beings exist day-to-day in a world preoccupied by statistical measures, ranging from numerous personal health metrics (blood pressure, PSA counts, temperature, oxygen levels, heart rate, etc.) to standard weights & measures (gallons, pounds, meters, temperature, etc.) to determinants of economic well-being (GDP, unemployment rates, inflation rates, interest rates, balance-of-payments, etc.) to statistical definitions of every area of our lives. Modern society could not exist without measuring nearly every conceivable thing.
Yet, many traders make no attempt to convert their Trading Performance into meaningful metrics. This is unfortunate because meaningful metrics are not simply interesting statistics – rather they can serve important functions:
- Dictate and guide the development of trading strategy
- Monitor trading outcomes against intended benchmarks
- Diagnose potential problems
Of course, most traders and investors are familiar with such Trading Performance measures as Rate-of-Return (ROR), DrawDown (DD) and the Sharpe Ratio (SR). Most professional proprietary traders I know find it laughable that the Sharpe Ratio is treated as the gold standard on Wall Street – the SR, quite frankly, is a joke because it penalizes upside volatility. Upside volatility is what I want. Many novice speculators place emphasis on two very deceiving trading metrics. – Win rate and absolute ROR. Both of these measures also have serious limitations and can be extremely deceptive.
There are three measures of performance I find to be tremendously important to govern my trading process and measure my trading outcomes:
- Profit Factor (PF)
- Gain-to-Pain Ratio (GtPR)
- Closed Trade NAV Curve
Profit Factor (PF)
These data points are determined on a sequential closed trade-by-closed trade basis. The ROR of each trade is calculated against total trading capital (your pot of money, actual or nominal, depending upon how you determine your level of capitalization) and plotted on a graph for each sequential closed trade. The formula for PF is simple.
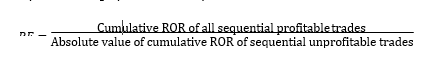
PF can be measured and plotted on a rolling basis using multiple time frames:
- Last “X” number of trades
- Last 12 months
- Last three years
- Last five years
- Lifetime of trading
In my opinion, PF is the one of the two most important metrics for trading performance. A PF above 1.5 is good, above 2.5 is excellent, and above 3.5 is world class (if based on at least five years of data). Preferably, PF should be tracked over the longest possible period of time. The Factor Tracking Account from inception has a PF above 4.0
Gain-to-Pain Ratio (GtPR)
The GtPR can be calculated with monthly ROR or trade-by-trade ROR data. The formula for the Gain-to-Pain Ratio is similar to that of Profit Factor except the numerator is the sum of all trades or months, depending upon whether monthly or trade-by-trade RORs are used.
![]()
GtPR measures exactly what it describes – the amount of pain required to achieve some level of profitability. As in the case of PF, the GtPR will always be a positive number unless the numerator (top number) is negative. GtPR preferably should be maintained for the previous three- and five- year periods, although maintaining running one-year data is an excellent way to statistically identify abnormal performance periods. GtPR is one of the two most important metrics for trading performance. A GtPR above 1.0 is good, above 2.0 is excellent and above 3.0 is world class. There is a caveat to these benchmarks. Short gamma programs run GtPR and Profit Factors ratios that are through the moon. These programs might maintain these ratios for a number of years … until they go broke. I do not recommend naked short volatility programs.
Closed Trade NAV (or cume ROR) Curve
On at least a monthly basis I update a graph of my cumulative closed trade-by-closed trade RORs. I consider this graph to be an extremely important measure of the health of my trading program for reasons discussed below.
- An unrealized profit in a trade is just that – unrealized. An unrealized profit belongs to no one. So, one might ask, “Why not then grab every unrealized profit quickly and convert it to a realized profit?”
- My answer to the above question – I believe in the concept of cutting losses short and letting profits run.
- My primary job as a trader is to cut losses as quickly as possible and allow winning traders room to become larger
- Historically my net trading profits have come from trades individually providing a 3%-plus ROR against my nominal trading capital. I would not realize these trades if I grabbed every unrealized profit quickly.
- It is easy to make money trading – the challenge is to keep it. By cutting losses quickly my drawdowns (closed- equity basis) are only one or two good trades from a new all-time NAV
- The sole reason I aggressively manage risk on each trade is to limit the downticks on the closed trade NAV curve.
- My goal is simple – do whatever is possible to keep the sequential trade-by-trade curve from DDs and allow for periodic trades (the 3-percenters) to provide upticks. In short – KEEP THE LINE CLIMBING
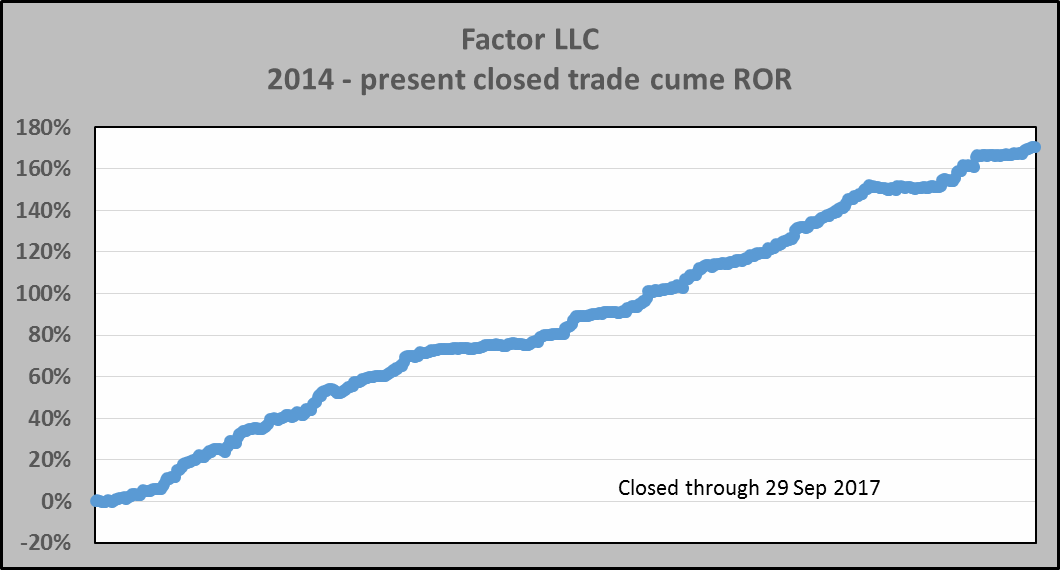
The graph herein displays the closed trade cume ROR curve for the Factor Service Tracking Account since inception (2014). There are good years and there are bad years. The sequential closed trade-by-trade NAV line has advanced smoothly. An NAV curve (plotted daily, weekly or even monthly) that includes open equity would show much greater volatility. My guess (I do not keep the data) is that the Factor Tracking Account’s NAV line would show periodic DDs of 5% to 10% if changes in open equity were reflected.
Factor Membership
.
Peter Brandt is a 40+ year veteran of trading. Through his Factor Service, members receive:
.
View your Factor Member options here. You could consider your membership in the Factor Service as just one more trade. If the Factor Service is not of value to you, well, it is just one more trade that did not work. Through the Factor Service I endeavor to alert novice and aspiring traders to the many pitfalls you will face – and to offer advice on overcoming those pitfalls. My goal is to shoot straight on what trading is all about. For more information watch my 30 minute webinar where we cover the Factor service in depth.
I hope you will consider joining the Factor community.


.


