

AUD/CAD – Chart Developing
AUD/CAD – This cross flashed a significant sell signal on Friday. I view short AUD/CAD as a potentially rewarding cross in the weeks and months ahead. This is a cross that can be traded in the spot forex market or using futures contract on a one-to-one basis, although such a trade would be over-weighted to CAD.
The longest-term charts show that AUD/CAD have remained in a broad trading range for many years.
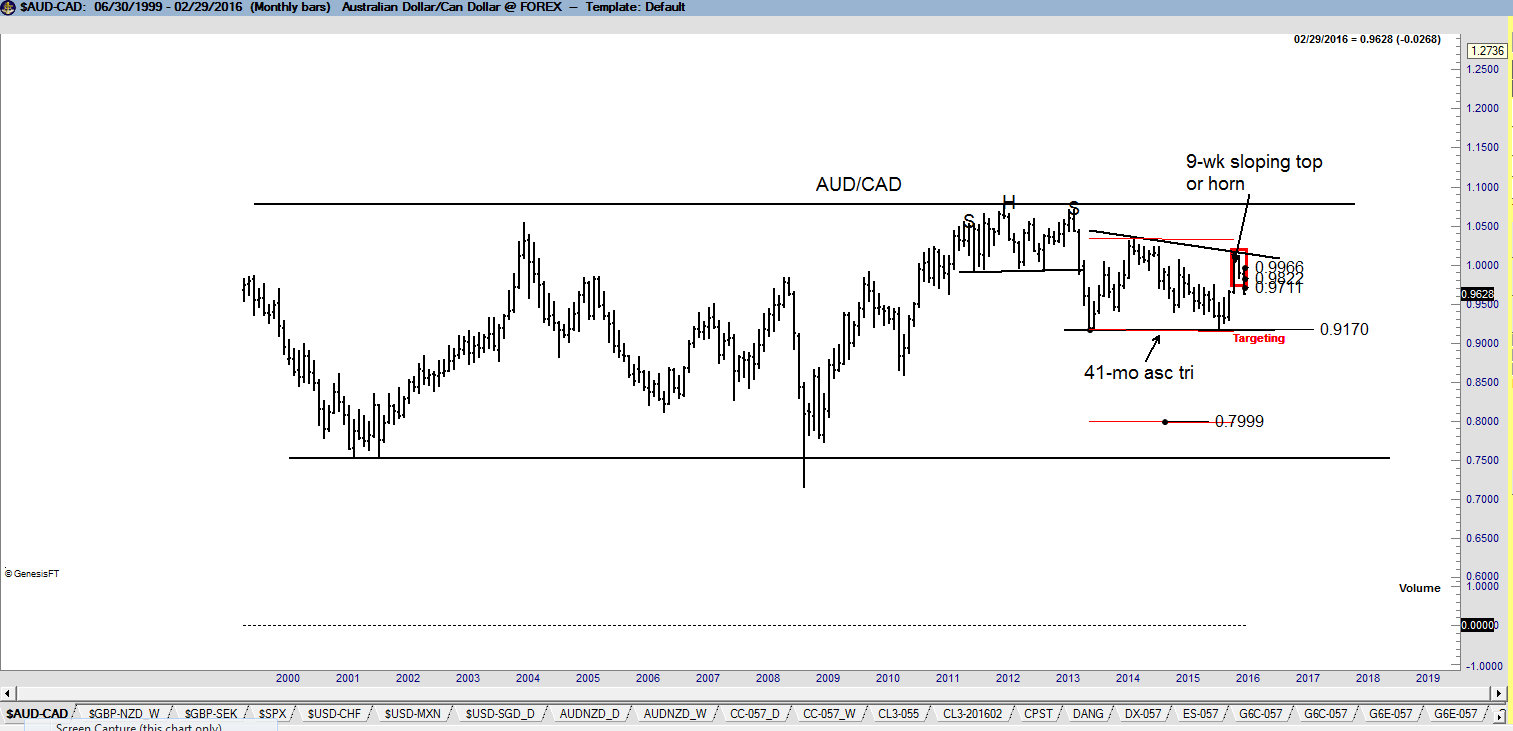
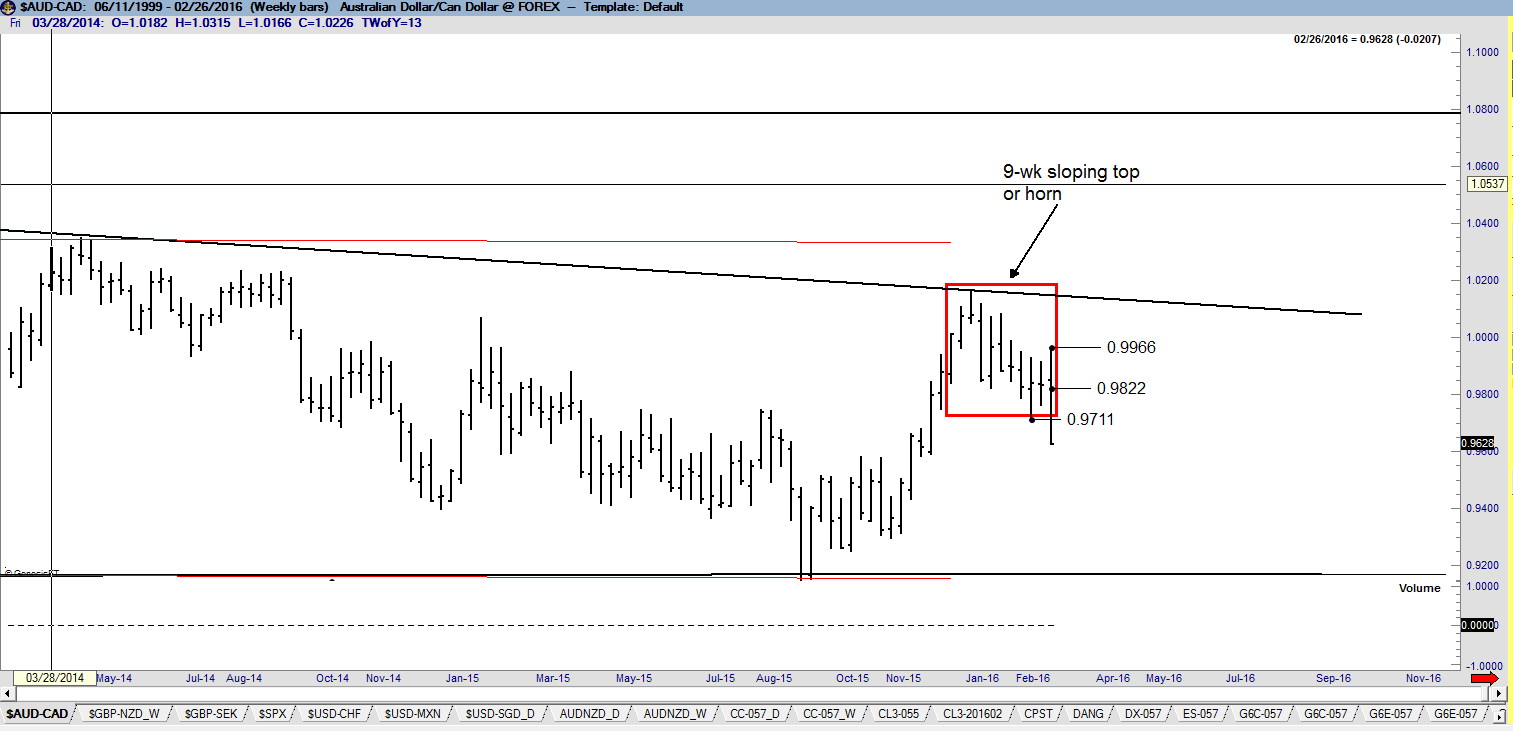
The weekly chart displays several patterns worthy of note. The decline in June 2013 completed a 24-month H&S top pattern. The decline from this H&S has queickly turned into a 41-month descending triangle pattern. This is this pattern that most has my attention. I believe that the completion of this descending triangle would result in a decline in AUD/CAD to the low end of the historical price range at .7600.
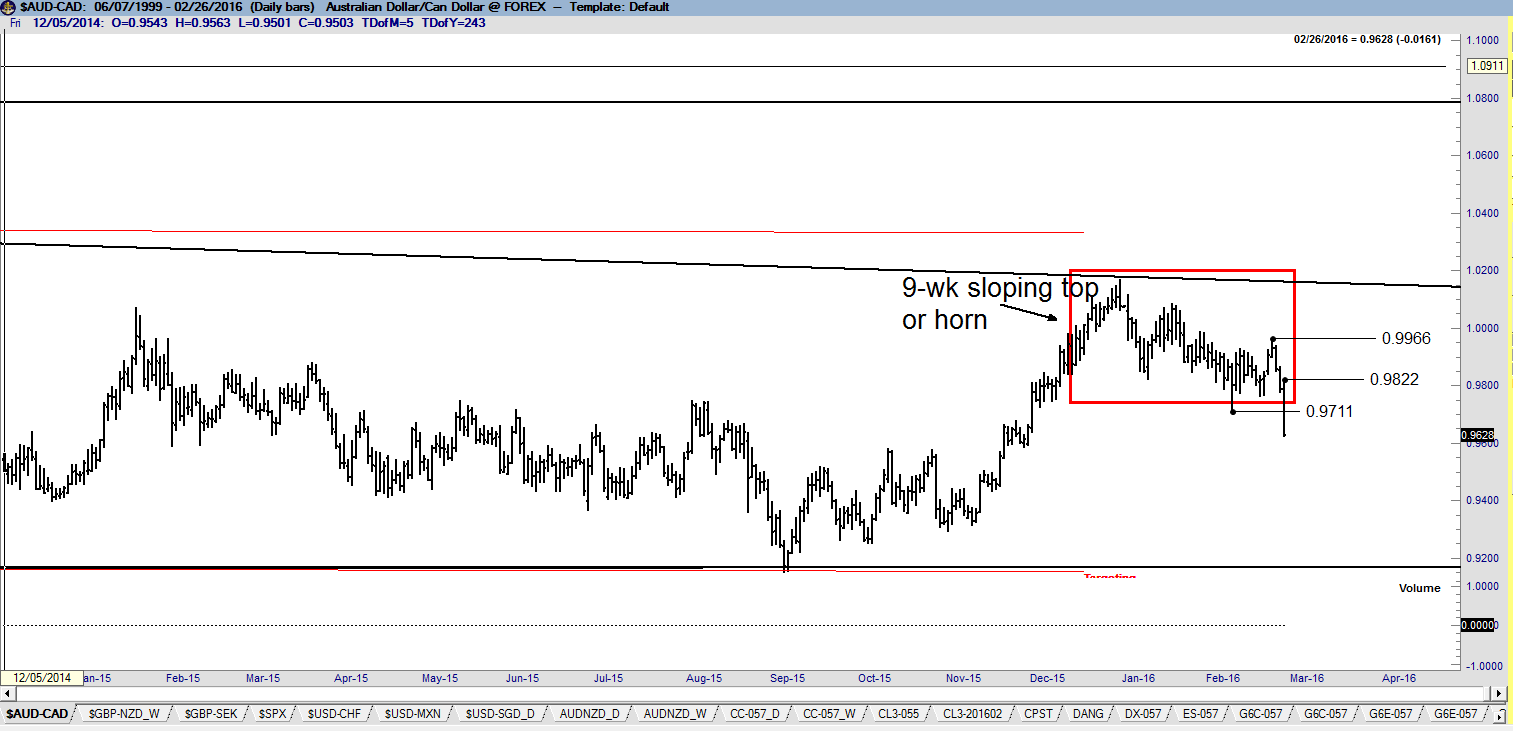
There is reason to believe that the final high within the descending triangle is in place. The sharp decline on Friday penetrated the Feb 9 and Feb 18 lows, thus completing a 9-week sloping or horn top. This top is completely adequate to warrant a short position. My risk points on a short position are the Feb 25 and Feb 26 highs. I am risking 50 basis points on the trade with an initial target of .9170. An eventual target of .8300 is possible.
The ideal spot for establishing or increasing adding leverage is in the .9700 zone.
I have no idea what the global marcro factors would need to be for the CAD to substantially gain against AUD. I will leave this question to those of you would this information matters.
plb
###


