

Is the present decline in the S&Ps a déjà vu of 2011?
Examining the chart structures of 2011/2012 with the present period
Classical charting principles at the core represent analog analyses — that certain price patterns tend to repeat over time with slightly different variations.
An interesting analog situation has developed in the S&Ps. Some technical analysts have declared that the current market construction is analogous to 2011/2012 and will be similarly resolved by a continuation of the dominant bull trend. I completely disagree.
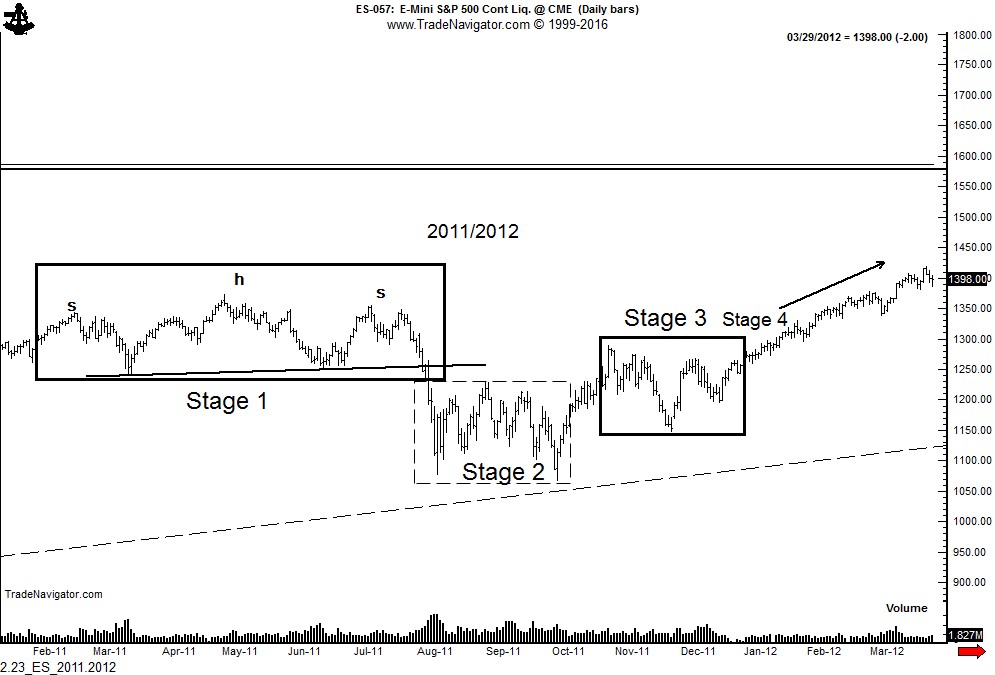
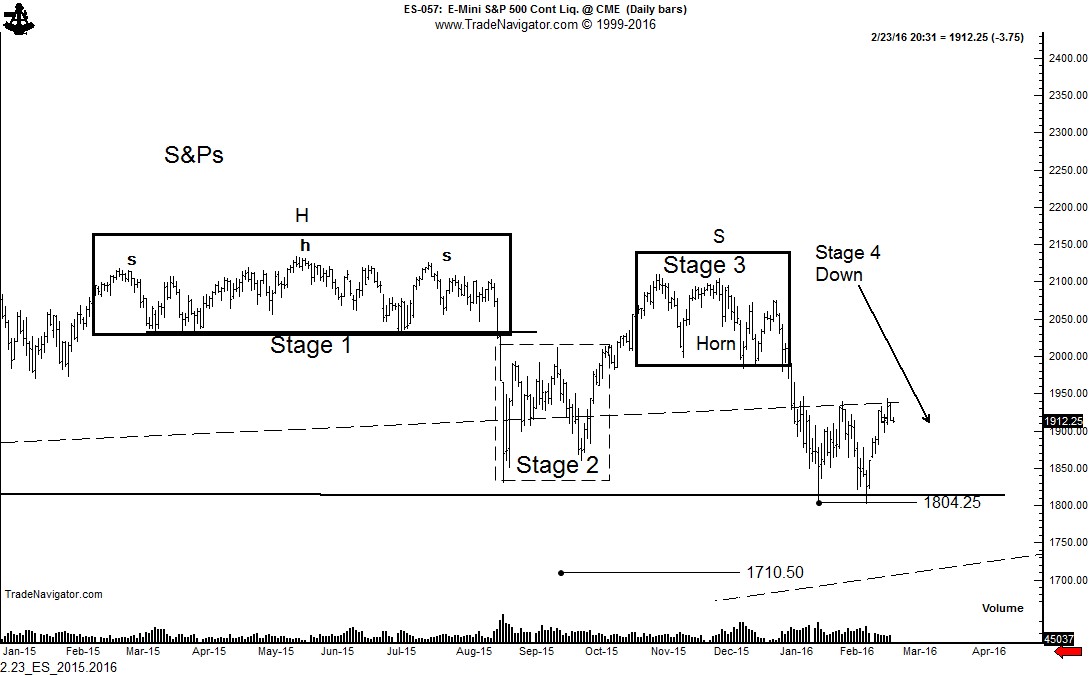
Let’s examine the construction components of each period. The top chart is the S&Ps during the 2011/2112 period. The bottom chart is the current market.
- Both periods had a textbook H&S top and, coincidentally, each top was completed in the month of August — both marked as Stage 1
- Both periods quickly met the target of their respective H&S top patterns only to develop a period of extreme volatility — both marked as Stage 2
- Both periods then rallied sharply back into the price zone of the initial H&S top pattern only to develop an other range of volatility — both marked as Stage 3
This is where the analog falls all apart — sorry bulls!
Stage 4 in the 2011/2012 period was followed by a continuation of the dominant bull trend that existed prior to the H&S top pattern. However, Stage 4 in the current period has been a resumption of the decline. Bottom line — analysts cannot compare the two periods. The analog has broken down. The liklihood is that the dominant trend in the S&P is now down.
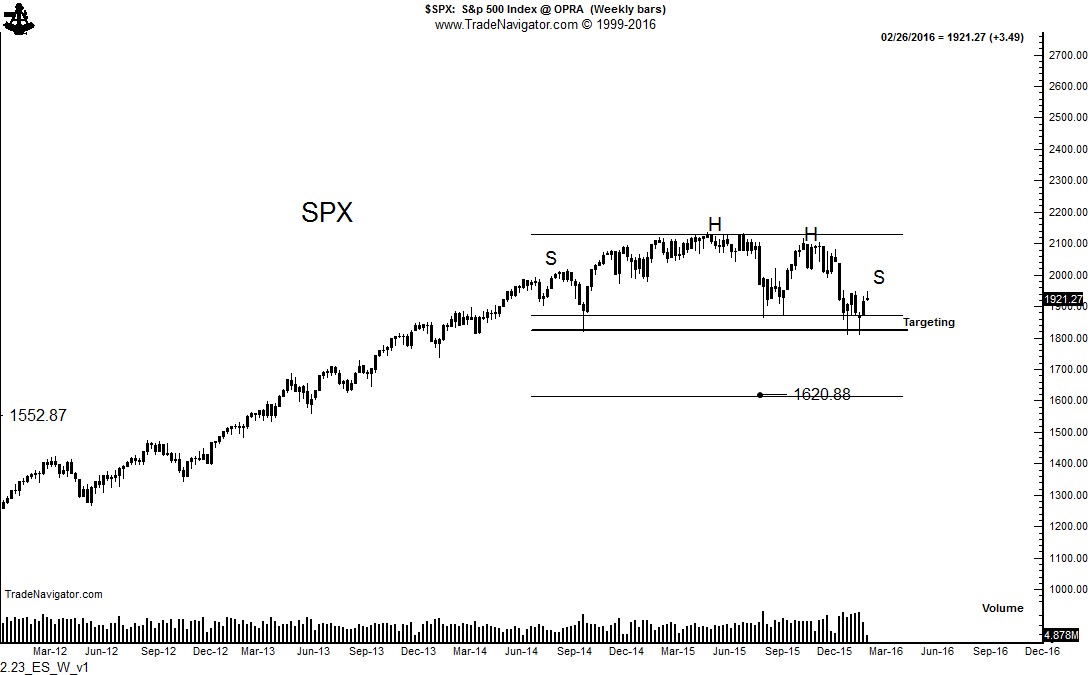
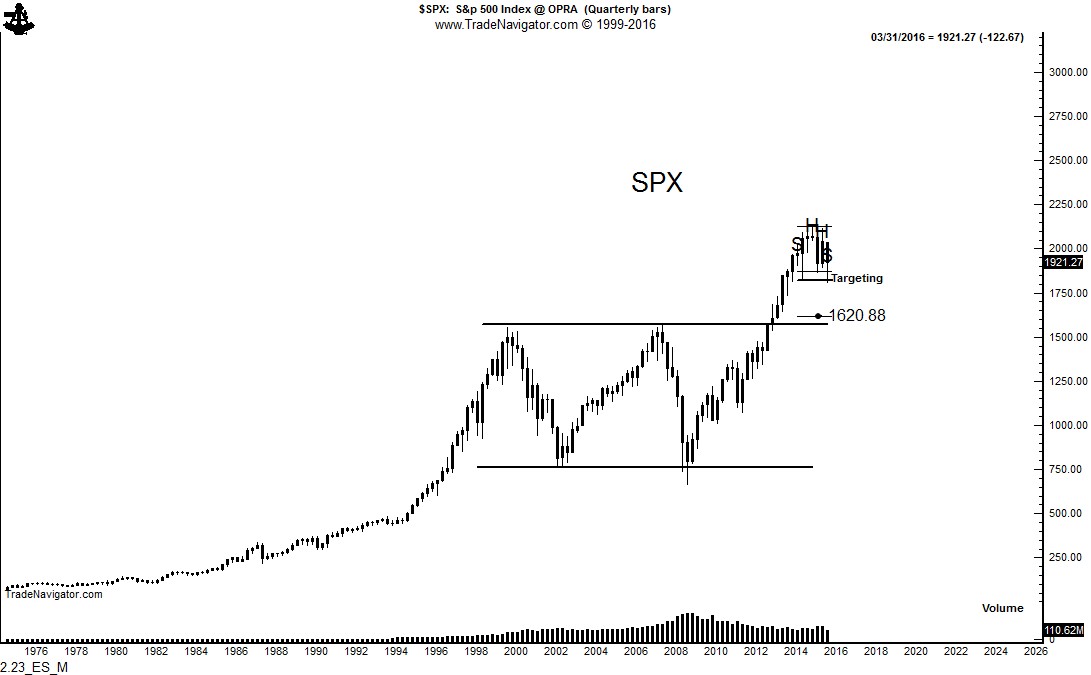
The weekly SPX chart displays a possible 22-month H&S or rounding top pattern, as shown below. This top, if it is confirmed by a close 1790, projects a decline toward 1620. Such a decline would represent a 24% drop from the 2015 all-time high. This would actually be a rather shallow bear market by historical standards. In fact, a decline to 1620 would be a simple retest of the 2013 breakout of a multi-year rectangle on the quarterly graph (bottom chart).
Note: I am not the first trader to examine the current U.S. stock market from the perspective of analogs. A fellow trader, Jesse Felder (@JesseFelder), examined the analogs of the U.S. stock market way back in November 2015 in The Felder Report. See here. By the way, I highly recommend any and all things written by Jesse.
Markets: $ES_F, $SPY, $SPX


