Factor Update – October 30, 2016
This content is for members only
This content is for members only
******************************************************************************
This content is for members only
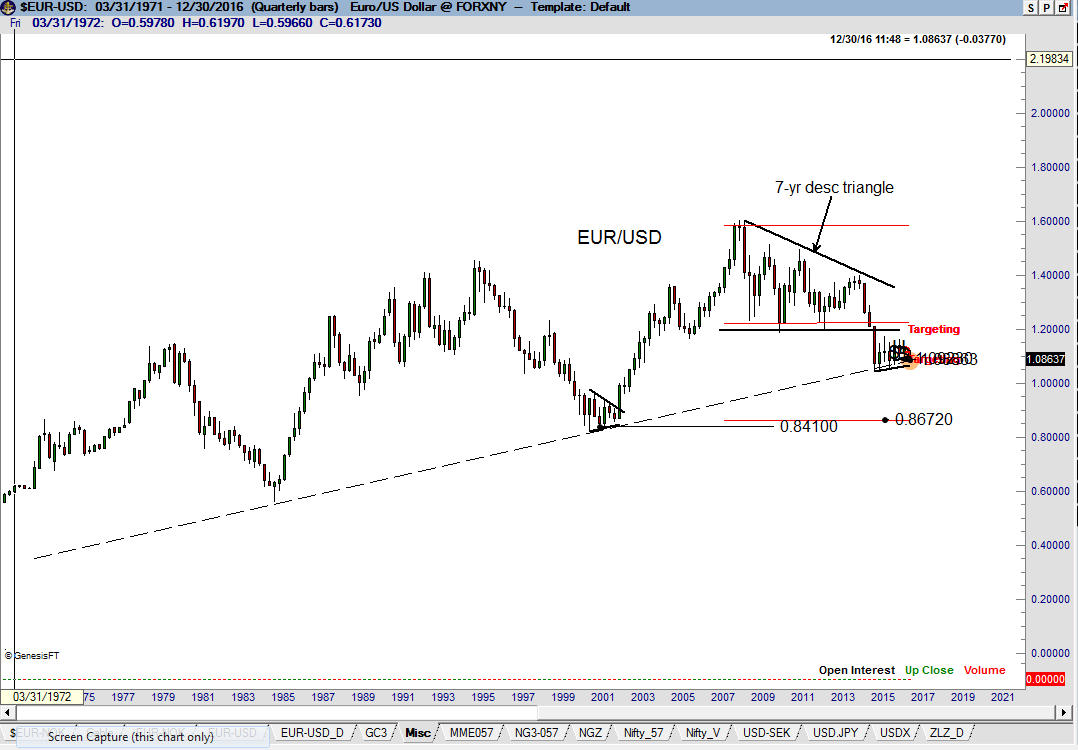
It is time to take another look at the Euro Dollar Forex Pair from the 30,000 foot level. The quarterly graph displays two prominent features. First, the 6½-year descending triangle top completed in Mar 2015 has an unmet target at .8670. Second, the decline in Mar 2015 found strong support at the 45-year trendline.
This content is for members only
This content is for members only
As usual I must emphasize that I deal in possibilities, not probabilities and certainly not certainties. Chart patterns develop and sometimes work out -- more often than not they morph or even completely fail. Nevertheless, chart construction can offer the opportunity for asymmetrical reward to risk trade set ups and that is the most a trader can expect.
A case can be made that the next $5 to $7 move in Crude Oil will be to the downside.
The weekly continuation graph has traced out a near textbook 15-month inverted H&S bottom dating back to Jul 2015. The neckline on this pattern ranges from 51.50 to 52.50 depending upon the roll date used to create the continuation graph (most active, first notice, last trading date). The graph shown below rolls at last trading date. A decisive closing price completion of this H&S pattern would set up targets of 62.58 (May 2015 high) and 76.40 (measured move of H&S).
The Aussie $ seems poised to gain on several other currency units based on the charts.
AUD/CHF -- the weekly chart displays a 22-month symmetrical triangle. A decisive close above the Apr 2016 high will be enough to warrant a long position. I am willing to risk about 60 BPs on the trade. Symmetrical triangles often lack reliability. Also, patterns longer than 12-months are more apt to experience morphing.
![]()
