Free ChartWizards Update July 1, 2026
Greetings,
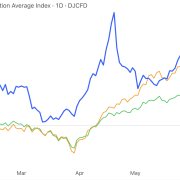
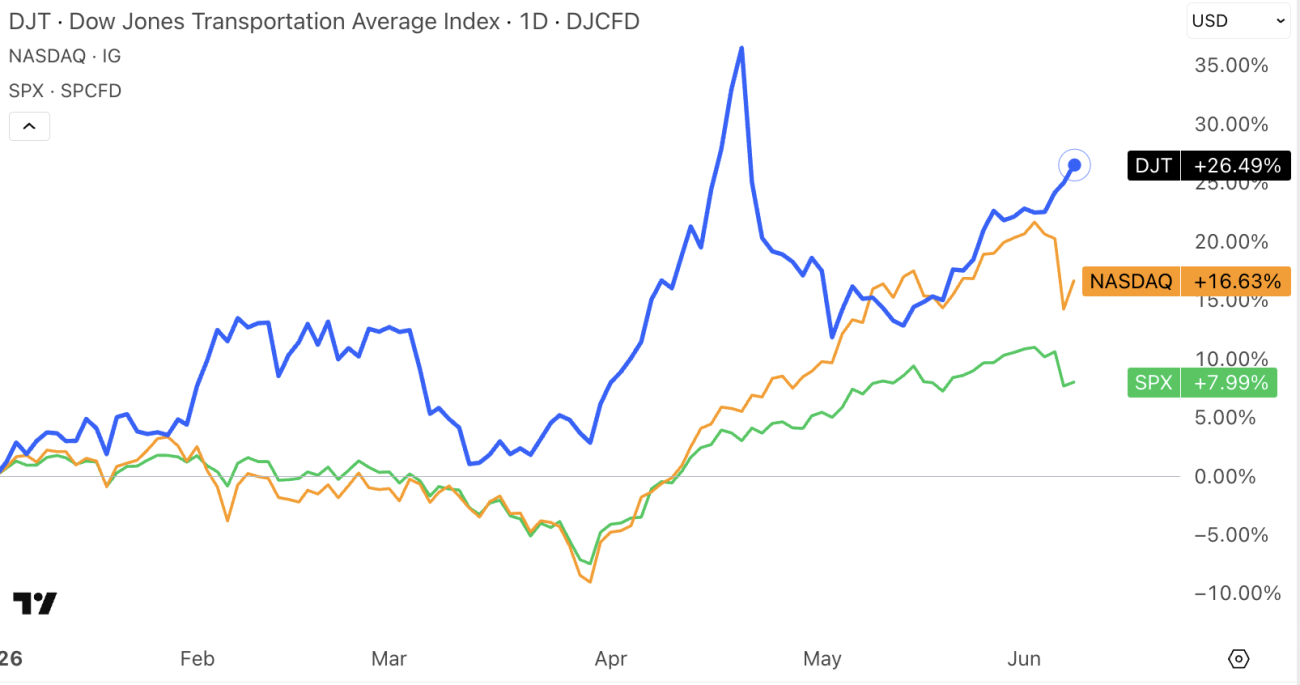
Each week, I send ChartWizards members a top-down view of global markets, covering the macroeconomic themes, ETF leadership trends, factor rotations, and classical chart structures driving performance across my portfolio and the broader opportunity set.
We’re here to walk alongside you, cutting through the “noise” to identify where capital is flowing, and define those tactical opportunities with clear structure, risk, and timing.
Over the next two months, ChartWizards will be moving to a new website and upgraded Discord service for members. This will give serious and aspiring traders and investors a cleaner home for research, discussion, chart review, and ongoing market education.
If that is the type of environment you are looking for, I encourage you to sign up now.
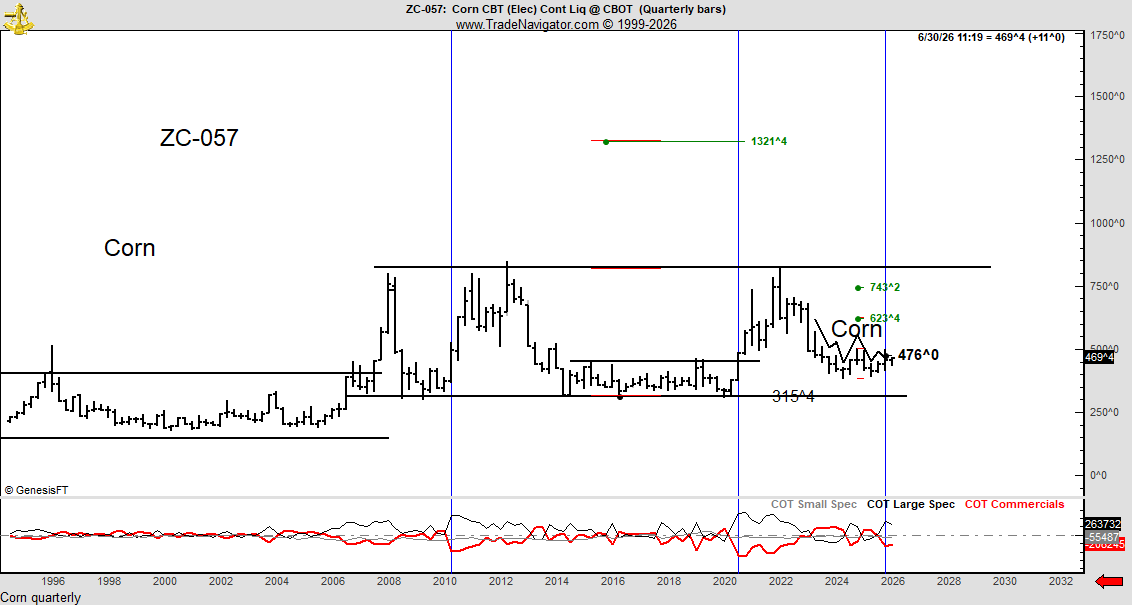
Below, you’ll find several of my favorite current chart setups, along with a 10-page PDF preview of the type of work ChartWizards members receive each week.
Thanks for reading, and safe trading.
#JK (Link to X)
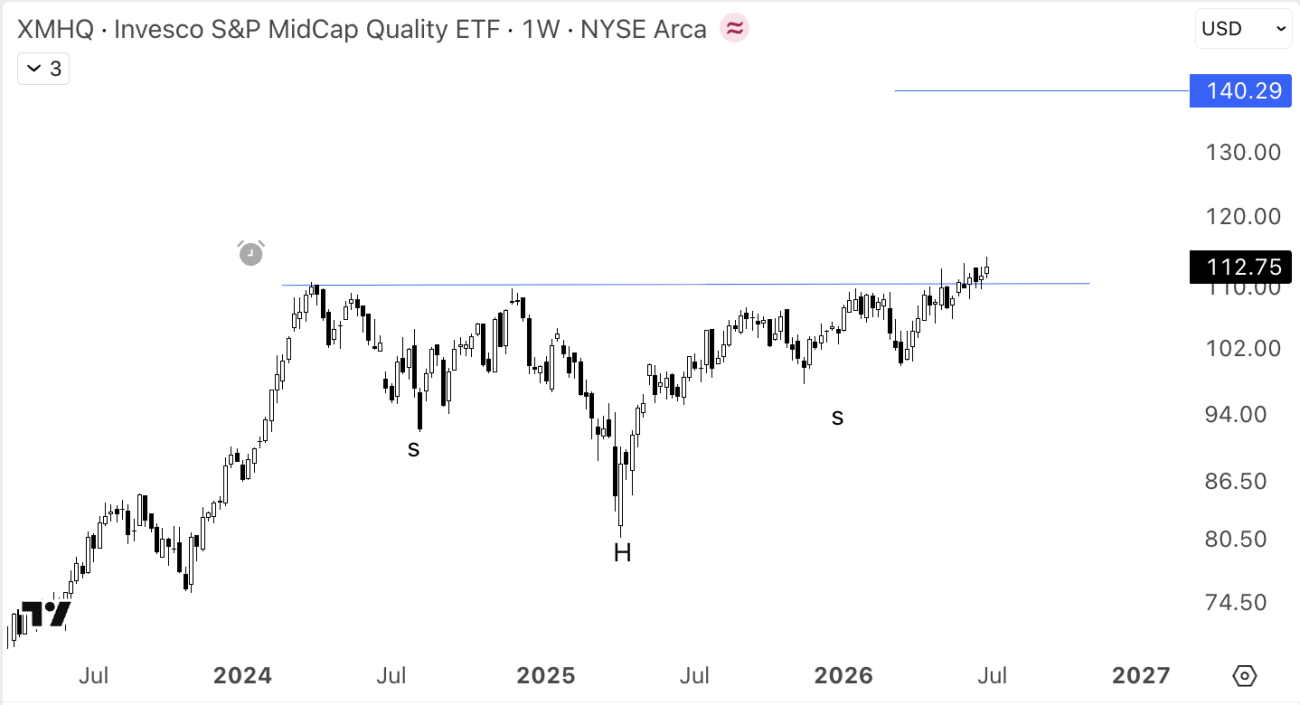
XMHQ Invesco Midcap Quality ETF
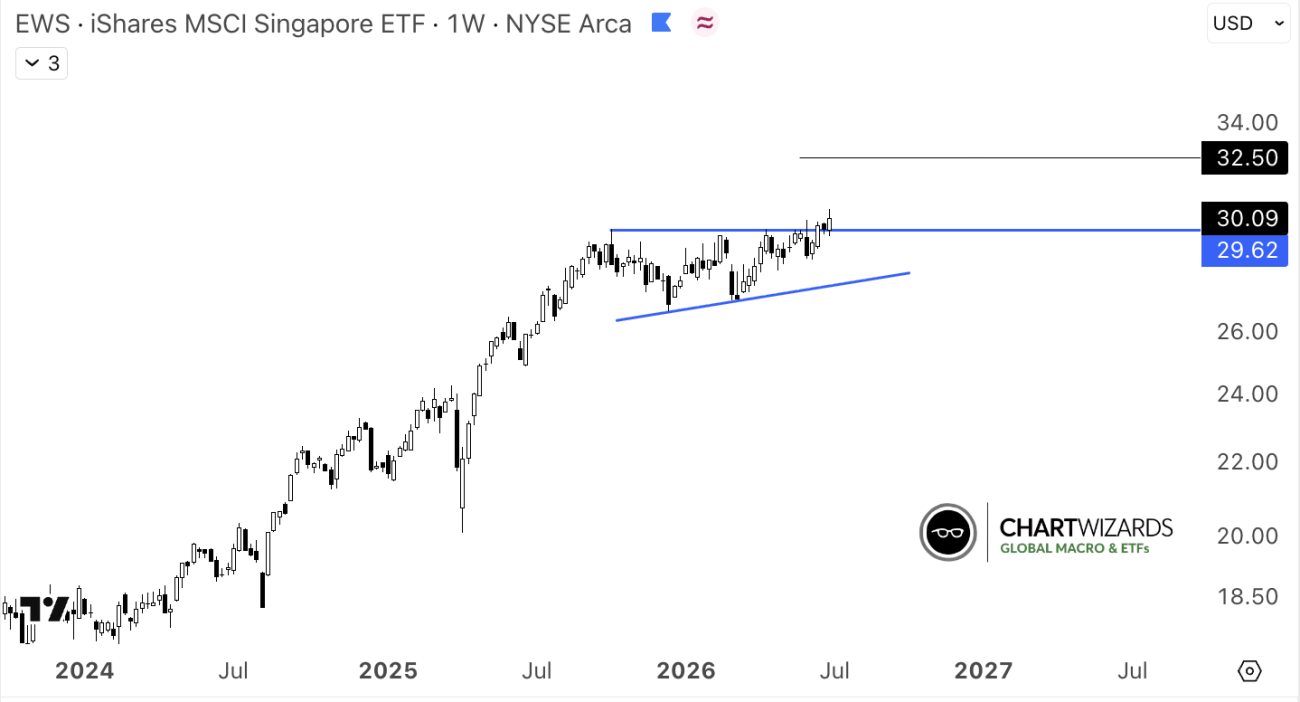
Singapore (EWS)
July 1 2026 CW Market update