It’s time for the CFTC/SEC/FTC and state attorneys general to do their jobs
In recent years there has been an explosion of “fraudulent” Prop Trading firms (herein, “Sham Shops”). I define how I use the term “fraudulent” herein.
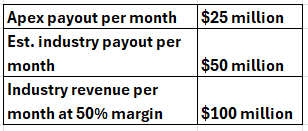
A new Sham Shop seems to be popping up weekly — I estimate that Sham Shops domiciled in the U.S. are raking in at least $50,000,000 per month (yes, that’s million) out of the pockets of wannabee futures market traders.
I intentionally use the word “fraudulent” because these firms are nothing like the traditional/historical structure of real proprietary trading operations. [A more complete description of REAL prop trading firms is contained at the end of this posting.]
These Sham Shops are stealing the dreams of thousands of novice and aspiring market speculators who think that the “prop” trading offered by these firms is the direct road to real futures market trading. In the process they may be violating several Federal laws and the laws of at least 25 states. [Note: I not an attorney. It will be incumbent upon regulators to review the charges I am making herein.]
It is shocking that Federal regulators such as the Commodity Futures Trading Commission, Securities and Exchange Commission, Federal Trade Commission and state-level gambling agencies have not investigated the legality of these U.S. based Sham Shops.
The remainder of this post has several objectives:
- The case for litigating Sham Shops on several fronts
- Recommended actions for those who have lost thousands (and tens of thousands) of dollars to the Sham Shops
- Reasons why the CFTC might look at this outrage with a blind eye
- A comparison of the business model of Sham Shops with the historical standard of proprietary trading as understood by real professional traders
- My recommendation to regulators
- Estimating the size of the sham in the U.S.
The possible legal case against Sham Shops follows
Legal case #1. The Sham Shops should be registered with the CFTC/NFA because they clearly and openly solicit business on the expressed and explicit basis that clients will have access to trade futures contracts
Every client of the Sham Shops believe that they have the opportunity to make money through the buying and selling of futures contracts (real or imagined). And, in fact, that is exactly the pitch they are sold by the Sham Shops. As a 50-year veteran of futures market trading, it is just unbelievable to me that these firms are not subject to CFTC registration. The business of this industry is TOTALLY dependent upon the price changes of U.S. futures contracts.
The fact that almost 100% of the trading offered by Sham Shops is hypothetical paper trading is irrelevant for two reasons in the opinion of this writer:
- The transactions of clients are based on the actual prices of the underlying futures contracts
- The transactions of the clients are monetized based on the price changes of the underlying futures contracts
I use the phrase “almost 100%” above because some Sham Shops are on record as stating that a selected few of their clients transition from simulated trading to actually trading real money with real futures commission merchants through real brokerage firms on real exchanges. And, this is exactly what these clients sought to happen by becoming clients of the Sham Shops.
It is a travesty that these firms are not required to become regulated by the CFTC/NFA.
Legal case #2. The Sham Shops are dealing in unregistered/unregulated and unlicensed derivatives
The Commodity Futures Trading Commission (CFTC) is a primary regulators of derivatives in the United States and the principal federal regulator of futures contracts. According to the CFTC, a derivative is:
“A financial instrument whose value depends on the value of one or more underlying assets, rates, or indexes, and which is typically used for hedging risk or for speculative purposes.”
The instruments offered to clients by Sham Shops in hypothetical via paper-trading simulations meet the definition “derivatives” almost perfectly.
The Sham Shops may argue that the instruments traded by their clients are futures contracts. They are not! With full respect to brevity I will skip the many differences between actual futures contracts traded at registered/licensed/regulated exchanges and the instruments bought and sold by clients of the Sham Shops. I am hoping that regulators are smart enough to understand the differences.
Have no doubt about it — transactions in these derivative instruments are monetized to clients according to complicated formula, subject to very complex trading rules and calculations of profitability and payouts. But these trading rules and calculations of profits that might accrue to clients are part and parcel of the unregistered, unlicensed and unregulated derivates offered by the Sham Shops.
Another, perhaps more accurate, way to view the instruments “traded” by clients of the Sham Shops is that they are Contracts for Difference (CFDs), not actual futures contracts. Trading CFDs is currently not a legal practice for U.S. citizens.
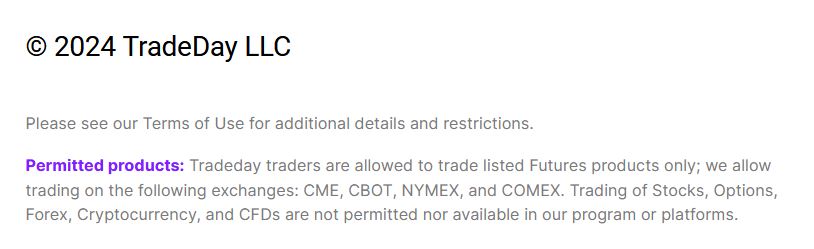
Some U.S.-based Sham Shops claim quite straightly that their clients trade REAL futures contracts. TradeDay LLC makes such a claim, as seen below. Yet, a search of the NFA member list for this firm comes up empty handed. Look for yourself at https://www.nfa.futures.org/basicnet/ [Editor”s note on Jul 20, 2024: TradeDay has stated in communications that it does have arrangements for clients to trade sub accounts of an actual master account in futures. I have requested additional information for review]
Legal case #3. The Sham Shops have assumed the role of unregistered, unlicensed and unregulated OTC commodity exchanges
Each Sham Shop acts as its own OTC exchange for the hypothetical buying and selling of its own derivative instruments. In a real sense the Sham Shops are taking the other side of their clients’ trades. As such, the Sham Shops assume the role of proxy Designated Contract Markets (DCMs) or exchanges. All exchanges are required to be registered, licensed and regulated — three operational aspects avoided by the Sham Shops.
The Sham Shop industry may claim that they are only vendors of the price discovery of the CME and other exchanges, data stream brokers and order entry software providers, but such claims are thinly veiled attempts at legitimacy in the opinion of this writer.
The Sham Shops may also claim that comprehensive disclosure documents are made available to their clients. This might be true, yet how do disclosure documents let the Sham Shops off the hook for acting as unregistered, unlicensed and unregulated commodity exchanges dealing in unregulated derivatives.
Legal case #4. The Sham Shops have assumed the role of unregistered, unlicensed and unregulated options brokers
The Sham Shops might claim that their operations are not subject to the same regulatory framework as FCMs because their clients are not subject to the same loss-of-capital-plus conditions of actual futures trading
In reality, the set-up and monthly fees charged to clients of the Sham Shops are proxy options contracts and should be viewed by regulators as such. Clients can lose 100% of the set-up and monthly maintenance fees charged by the Sham Shops. The risk/reward matrix of prop trading with the Sham Shops is quite similar to the risk/reward matrix of options on futures contracts. Clients are simply saying, “I will pay a certain fee as a bet that I can beat the dealer.”
Legal case #5. The Sham Shop version of prop trading is basically a form of illegal online gambling/gaming/betting
In 2006 the U.S. government put into place a federal statute that defines and references gaming known as the Unlawful Internet Gambling Enforcement Act (UIGEA). While the act does not provide a comprehensive definition of “gaming,” it does define “unlawful internet gambling” as:
“To place, receive, or otherwise knowingly transmit a bet or wager by any means which involves the use, at least in part, of the internet where such bet or wager is unlawful under any applicable Federal or State law in the U.S.“
It remains the burden of the U.S. Justice Department and the Federal Trade Commission to determine if the Sham Shops are violating federal internet gaming statutes.
Legal case #6. The Sham Shops are violating state laws against unregulated internet betting/gaming/gambling
The clients of the modern version of prop trading are betting money (start-up and monthly fees) that they will successfully predict the price changes of unlicensed, unregistered and unregulated proxy futures market prices in accordance with complex calculations and rules.
Any way you look at it, the Sham Shops are engaged in unregulated internet betting/gaming/gambling. Their clients are placing their chips as an online bet that they can beat the game.
Betting on the price changes of proxy unregulated futures derivatives is very similar to online betting on sporting events in that the bettors (clients of Sham Shops) are gambling their monthly set-up/monthly fees to parlay their bets into a considerable profit.
Twenty five states allow their citizens to engage in online sports gaming — and in every case these states require the sports betting operations to register with the state gaming commissions. Thus, another 25 states outlaw online gaming.
Yet, in my opinion, Sham Shops are bookie operations offering online gaming.
I have advice for all U.S. citizens who are in the hole with the Sham Shops. Calculate your total lost capital and submit a request to your Sham Shop to reimburse you IN FULL. Make sure you also file a complaint with your state’s gaming commission, informing them that your losses represent money paid to an unregistered online gaming company — then keep them appraised of your refund request.
Legal case #7. The operations of the Sham Shops look very much like Ponzi schemes
A Ponzi scheme is defined as a type of investment fraud where returns are paid to earlier investors using the capital from newer investors rather than from profits earned by the operation of a legitimate business. The Ponzi relies on a continuous influx of new investors (or reboots from existing investors) to sustain payouts, as there are no actual earnings.
This definition precisely defines the business plan of the Sham Shops. No actual trading in real futures contracts through real FCMs on real exchanges are involved with the Fraudulent Prop Trading Industry. Rather, a very small proportion of clients (perhaps 5% or fewer) make net profits over a time continuum. The profits of the few becomes the entire marketing scheme by the Sham Shops to bait and hook new clients.
Legal case #8. The marketing structures of the Sham Shops might be deemed as pyramid schemes
The cornerstone of the marketing pitch by the Sham Shops is the hype pumped by a small minority of those who qualify for payouts. The reality is that the Sham Shops do NOT want all clients to tap out — they need the chosen few to pump the millions made via social media and YouTube channels.
These chosen few then PUMP PUMP PUMP their Fraud Shops as commission-paid “affiliates.” And, herein is a major issue.
The legal case can be made that the social influencers paid by the Sham Shops constitute pyramid schemes. As such, these social influencers could be found culpable if courts convict Sham Shops of running pyramid schemes.
A pyramid scheme is a fraudulent investment strategy that recruits members by promising payments or services for enrolling others into the scheme rather than supplying any real investment or sale of products. These schemes rely on the continual recruitment of new members to provide returns to earlier participants, creating a structure that resembles a pyramid.
An example is Apex Trader Funding, Inc., one of the largest Sham Shops in the U.S. Clients of Apex are invited to become affiliates — to receive a lifetime 15% commission of eventual fees paid to Apex from referred customers. The majority of Sham Shops offer affiliate deals.
Here is an example of the pyramid.
Legal case #9. Sham Shops might be illegally operating as Introducing Brokers
Sham Shops draw a very slippery and grey distinction between hypothetical not-for-real simulated paper trading and actual futures trading. A goal of many clients that enter the Sham Shop world is to qualify as a trader of actual futures contracts. Sham Shops are aware of this fact and are not completely transparent to make clear the impossibility that clients will be granted real money to trade actual futures contracts.
The reality is that no actual futures contracts are traded by the any client of any Sham Shop. Yet, at least in the case of Apex Trader Funding, the separation is extremely blurred between sim accounts and real accounts, as seen below.
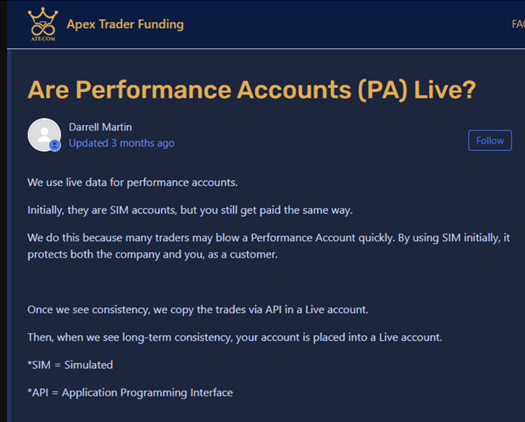
This web content from Apex suggests strongly that clients can progress to real accounts trading real markets through real FCMs on real futures exchanges. But this just is not the case. Or at least it better not be.
Yet, Apex and other U.S. domiciled Sham Shops refer their clients to exchanges such as the CME and CFTC regulated FCMs such as Tradovate and NinjaTrader. It is the opinion of this writer that the business referrals to FCMs for any purpose by Sham Shops should require registration as Introducing Brokers at the very minimum. Such registration would impose strict regulation of many aspects of Sham Shop operations which are running amuck without transparency and scrutiny.
It is incumbent upon the CFTC and NFA to closely examine the relationships between Sham Shams and exchanges, FCMs and other CFTC registered enterprises.
Hey Sham Shops, if you are actually transitioning your Sim clients into real actual futures trading accounts, please let me know who you are — because you should probably be the first Sham Shop the CFTC investigates.
Legal case #10. Other possible legal/ethical violations by the Sham Shops
Firms registered and regulated by the CFTC must also join the National Futures Association (NFA), an industry self-regulatory body with substantial investigatory and enforcement capability. The NFA takes its charter seriously in most instances.
It is the belief of this writer that the Sham Shops would would NOT fair very well if subjected to the type of regulatory oversight imposed upon NFA member firms.
The operational structures and promotional messages of the Sham Shops should leave potential regulators in shock.
Following is a screen shot of the YouTube channel for Apex Trader Funding.

The promotional messages of Apex (and other Sham Shops) are not balanced in the communications of risk vs. reward. Accuracy is also a standard of the CFTC/NFA. For example, the NFA would most likely require audit-level investigation of the $1 million claim. The inability of Apex to verify such claims in all promotional channels would likely result in large monetary fines at a minimum.
The NFA also reviews the activities of its members to determine “unprofessional, improper and “un-business-like conduct.” The NFA would have an absolute field day with the Sham Shops enforcing this standard.
Lack of corporate transparency is one characteristic of the Sham Shops. For example, Apex Trader Funding suggests it has collected at least $85 million from wannabee traders in the last three months. That is a big-time operation. Apex self reports itself to be the largest Sham Shop in the U.S. Yet, Apex appears to be a ghost. It uses a post office box in Austin TX as its only published address and reaching a live voice at Apex is basically impossible.
Social media is flooded with complaints against the Sham Shop industry by clients. The complaints tend to be clustered in several categories:
- Slippery and ever-changing rules on payoffs
- Rude treatment by customer service personnel in resolving complaints
- Non-payment of eligible profits
- Unauthorized position close-outs by the Sham Shops of customer paper trades
- Delayed responses from Sham Shops on urgent issues
- Rules changes on trading procedures that favor the Sham Shops
- Misrepresentation of trading history by Sham Shop executives
Apex is an example of a Sham Shop that has complicated rules for payouts — and rules that seemingly are always in motion.
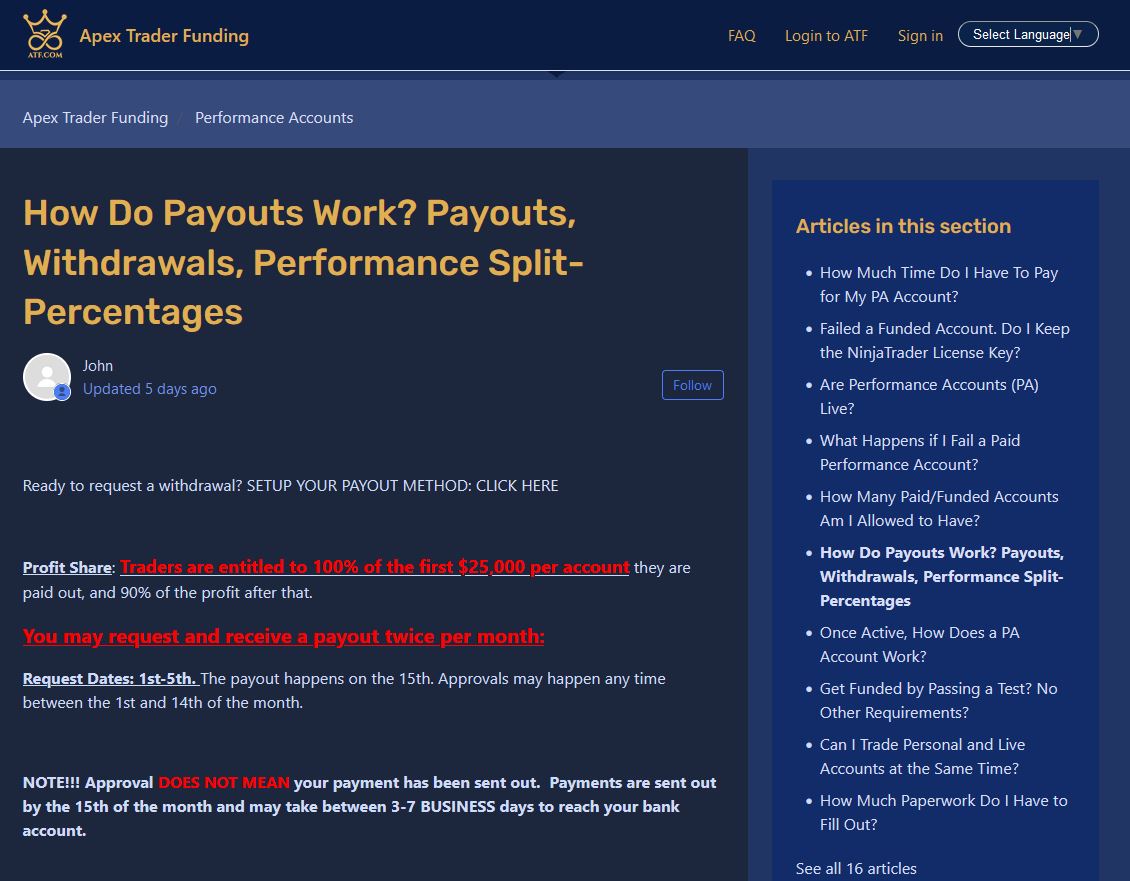
Link to current rules at Apex is https://support.atf.com/hc/en-us/articles/10403497070363-How-Do-Payouts-Work-Payouts-Withdrawals-Performance-Split-Percentages
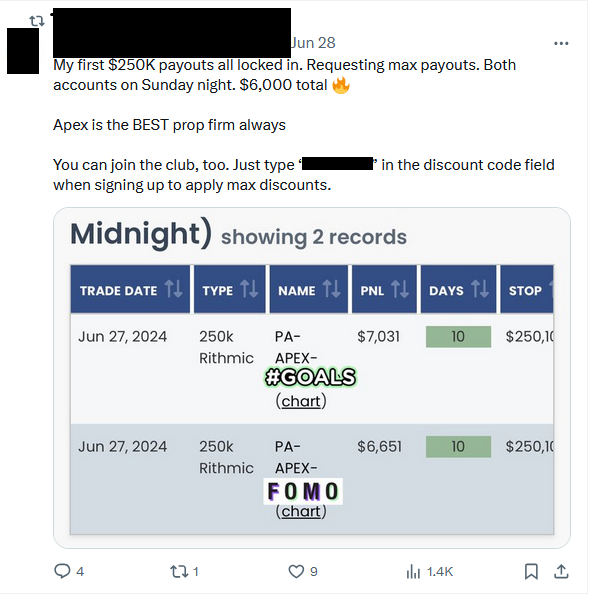
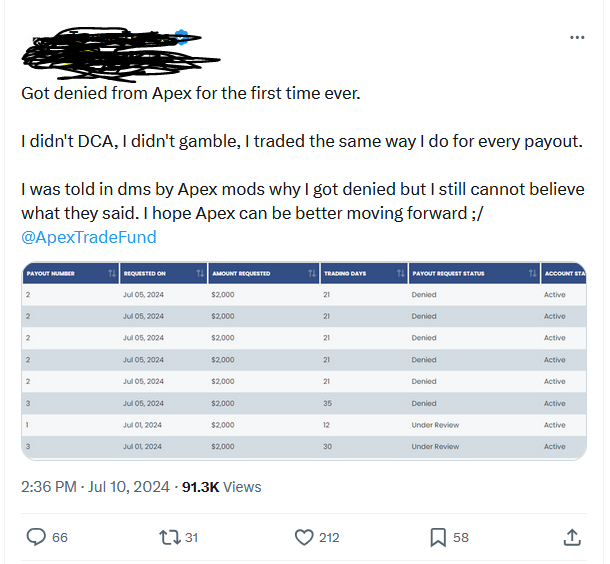
Following is one of many Twitter X posts from traders who were denied payments. I have communicated with many of these traders — they are credible and claim that their Sham Shop changed the payment rules mid-stream. I believe them to be truthful. I have scratched out the name on this Twitter X post because Apex (and other Sham Shops) have a history of terminating business with clients who air the dirty laundry of the fraudulent prop firms.
As an ethical issue (separate from a legal issue), the rules/guidelines/allowances imposed upon the clients of the Sham Shops almost guarantee trading failure. Verified by academic research and the experiences of many market speculators, day trading is the most dangerous time frame for trading. Yet, simulated day trading is rule for clients of the Sham Shops.
The leverage allowed by these phony prop houses would be disastrously high if employed in real trading. For example, according to its web page, Apex allows clients with a sim $100,000 account to trade 14 mini contracts at a time. The underlying value of 14 E-Mini S&P (ES) contracts at the close on Jul 10, 2024 was $3,978,100 — representing 40X leverage. Some experienced traders with outstanding risk management techniques would blow up trading 14 ES contracts per $100,000 — how would you expect a novice wannabee trying to “kill” the markets to do?????
At least two other problematic dictates are made upon clients by most Sham Shops.
- Unrealistic asset volatility restrictions
- Requirement to trade and be profitable a certain number of days each month
- Drawdowns limited to 1-2%
Most professional career traders say that all traders must develop their own unique style to be consistently profitable. Yet, the Sham Shops jam their clients into restrictive boxes with rules and guidelines that this writer believes are optimized for clients to fail. Sham Shops need the vast majority of their trader clients to fail — and IMO they have optimized their business plans to accomplish this goal.
A hallmark of the Sham Shops and their social influencers is the false claims of trading profits. There are NOOOOOOOOOOOOOOOOO trading profits, sorry folks. I have challenged the Sham Shop industry to send me a copy of even one FCM brokerage statement showing a trading profit, much less an actual trade or one IRS form 1256. I’ve not received a single response.
A signature of Sham Shops is the misrepresentation of trading experience by company executives. For example, @TradeDayFunding ‘s web site (tradeday.com) lists extensive trading history for its executives, James Thorpe, Steve Miley and Tera Vicker. But wait! None of these people have any history of registration as futures brokers with the National Futures Association. Futures brokers are required to register with the NFA. [Editor’s note on Jul 20, 2024: TradeDay has responded to the statement herein, claiming that its principals were not required to register with the NFA. I have requested additional information.]
Recommendations for traders who have lost money to Sham Shops
My sense — and I hope I am wrong — is that most victims of the Sham Shops have Stockholm Syndrome. Why? It’s the same emotional driver of FOMO. It’s greed without check. “After all,” Sham Shop suckers will say, “it’s only a few hundred dollars per month for unlimited upside potential.” Victims do not like admitting they have been had.
For those victims of Sham Shops who want to address their victimhood, I recommend the following:
- Yell loud and often on social media, calling out Sham Shops by name
- Write a letter of complaint detailing any grievances you might have with your Sham Shop(s). Send the letter with a copy of this blog post to:
- The gambling commission in your state. Communicate that you have lost money to an unregulated OTC gaming operation.
- The National Futures Association
- The Commodity Futures Trading Commission
- The Chicago Mercantile Exchange
- Total up your damages – send a certified letter to your Sham Shop requesting full and complete recovery.
- Keep others posted via social media
Traditional Prop Trading vs. Sham Shop Prop Trading
The futures market Prop Trading offered by the Sham Shops is anything but proprietary futures market trading. Rather, it is the gambling of unregistered and unregulated OTC derivatives.
The table below compares the “prop” trading offered by Sham Shops with the traditional structure of true prop trading as understood by long-time futures trading professionals.
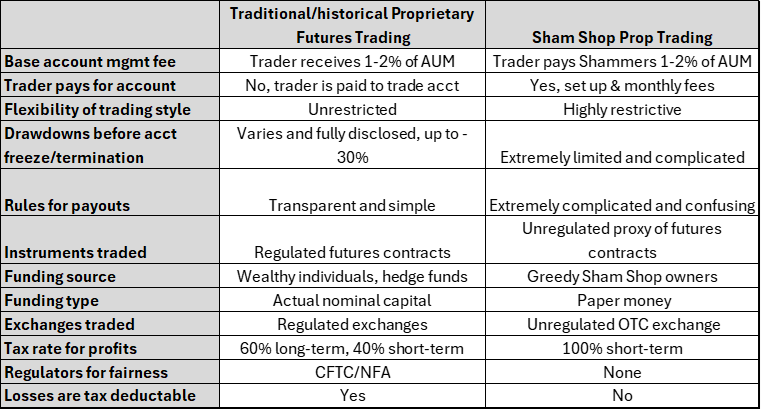
In real and traditional prop trading ALL parties are pulling for each other. Real prop trading firms want their traders to be profitable. In contrast, Sham Shops only make money if their clients in composite lose money. How is this idea not the definition of “conflict of interest.”
One final point is worth noting. The REAL futures markets are considered to be a “ZERO SUM GAME.” There is a short for every long. For each $1MM made by a trader there is $1MM lost by a trader (of course adjusted for fees of approximately .005% per futures contract). The “trading” offered by Sham Shops are not zero sum. My estimate is that 90-95% of Sham Shop clients lose money annually.
Recommendations for CFTC, state gaming commissions and the CME
I highly recommend simulated paper trading for aspiring novice traders as well as for experienced traders who want to test new strategies. In fact, I recommend to new traders that they paper trade for at least two years prior to placing their first real trade. The problem is not paper trading.
Rather, the problem is unscrupulous firms that stretch the law to separate traders from their money.
Here are my recommendations:
- Sham Shops should be required to register with the CFTC/NFA — category TBD, but the category of Sim Exchange is suggested
- Sham Shops should be required to cease business activities until the NFA can completely review their business structures and all communications channels
- NFA should solicit and review letters of complaints from Sham Shop trader clients
- The CFTC should demand from overseas Sham Shops a completed list or their U.S. clients
- The new rules for trading for clients might be as follows:
- Client pays for an account set up — let the market place compete for price and details
- Sham Shops may charge clients whatever the market bears for account set up fees, ongoing hypothetical order placement software, sim accounting fees, and sim brokerage commissions. All such fees must be clearly separated and disclosed to clients
- Sim accounts remain open until client decides termination or account goes on hypothetical margin call
- Clients have complete freedom to trade sim account, including overnight holds
- Margin requirements are attached to all paper trades
- Clients pay for live data feeds
- Clients may carry multiple accounts but all covered by one data feed
- Sham Shops must clearly differentiate between the sim hypothetical proxy futures contracts being traded and actual real exchange traded contracts that are not offered
- Sham Shops must not interfere with the trading style of clients in any way. If a client sim account goes into margin call or deficit the account can immediately be closed
- Sham Shops must annually publish the following data:
- Total number of clients with open and traded accounts the previous year
- Total number of sim accounts traded the previous year
- Percent of clients with net simulated profits or losses the previous year
- Percent of sim accounts traded with net simulated profits or losses the previous year
- Of the Form 1099 reported payments to social influencers, a report on the proportion paid for “trading” profits vs. the proportion paid for affiliate commissions
- Any and all social media “affiliates” and/or social influencers must also be registered as Introducing Brokers with and subject to the NFA
- In short, sim accounts should be treated as if they were real account trading real futures markets.
- Any Sham Shop that refers clients to an actual FCM must register as an Introducing Broker and be subject to corresponding regulations
Size of the Sham Shop industry in the U.S.
I estimate the annual revenue generated by U.S. supposed “Prop Shops” to be $1.2 billion per year.

Apex has posted its monthly payouts on line. Assuming that Apex pays out 50% its revenue, then assuming that Apex has 50% of the market, then the Sham Shops domiciled may be raking in $1.2 BILLION annually.
“Prop” futures trading firms believed to be domiciled in the U.S. include:
- @topstep
- @apextradefund
- @tradedayfunding
- @myfundedfutures
- @elitetraderfund
Note to Sham Shop operators. You all will vigorously deny the allegations in this blog post. If you are so sure of the legitimacy of your industry, then please take the initiative to as vigorously join the National Futures Association and request from them oversight of your business. I am quite sure doing this is the last thing on your mind. I believe yours is a Predatory business enterprise aiming at making money at your client’s expense. I believe you need some of your clients to make money (lots of it) so that you have a promotional edge to bring more lambs to slaughter.
### for now