The Public Blog site
The StockTwits stream…picking up nickels when there is a line handing out dollars
/by Peter BrandtYesterday’s drop in $EURUSD highlights the extremely short-term view of many traders in the StockTwits stream
This post is sure to step on some toes…but I have stepped on toes before and I will step on toes in the future. So here goes…
Let me emphasize that what I have to say in this post is not aimed at all participants in the StockTwits stream. There are many excelllent analysts, traders, risk managers and bloggers in the stream. You know who you are from your brokerage statements.
But, the StockTwits stream contains a significant amount of thinking and market manuevers that are — in my opinion — dangerously short term.
Yesterday morning I came into the office to find the $EURUSD down about 200 pips and experiencing the completion of a major bearish triangle. Not being a regular follower of fundamentals, I went to the stream to find out the reasons for the weakness. Within a matter of minutes, here are some of the stream posts I read:
- 1.4015 Long/ 30 stop
- freefall done for now, tempted to long here
- looking extremely cheap
- I believe him EURUSD
- 60min Buy in the dip!
- traders getting long
- Great bullish pattern on EURUSD, buy on the dip lol… long…
Frankly, I could not believe what I was reading. To make myself clear, I am not against a tradng system that includes a component for buying or selling a market based on a return to the mean from a price that is a certain number of standard deviations out of line. But, this was not the spirit of what I was reading.
Rather, I sensed way too many traders attempting to catch a falling knive because they missed the move down. And to me, this was an indication that the StockTwits stream has many market participants who make a habit of standing in line to pick up nickels when the next line over is handing out dollars.
If you consistenly make money catching knives, all the more power to you. I will never fault a person who has figured out a way to make a living from the markets. But, I strongly believe that such short-term trading is dangerous for many novice and aspiring traders for two reasons.
The first reason is that small miscues, misjudgements, execution snaffus and the like exponentially add up to become major hurdles to success as a trader’s time horizon shrinks. The second reason is that really significant trading profits come from the practice of holding positions and not by active trading. Additonally, the shorter term a trader becomes, the more he or she is competing with sophisticated HFT operations. And, whether a short-term trader uses market or limit orders, they need to know that they are buying at the offer and selling at the bid. HFT operations, in contrast, manipulate the computer trading environment in order to buy at the bids and sell at the offers.
So, if the shoe fits from what I have described, then wear it. If it does not fit, then ignore it. But if you have been standing in the nickel line and are unhappy with your overall trading results, I suggest you move over to the dollar line.
$STUDY
###
Gold/Silver ratio — on its way to 50 to 1?
/by Peter BrandtSpeculative public is long 8 billion Euros — let the rout begin!
/by Peter BrandtGold makes new-all time highs against Euro$
/by Peter BrandtThree chart patterns to watch this week — Gold, Soybeans and EURUSD
/by Peter BrandtSoybeans — Ready for second stage launch?
/by Peter Brandt$EURUSD at a critical juncture
/by Peter BrandtNikkei 225 and 10-Yr. U.S. Note Rates — Go Together Like a Horse and Carriage
/by Peter Brandt When the timing is right, going long Japanese stocks and short T-Notes (prices) will be quite a ride
As a technical chart trader I look for price patterns that repeat themselves in different markets in different time periods. I also look for simiilar patterns in different (often unrelated) markets at the same time.
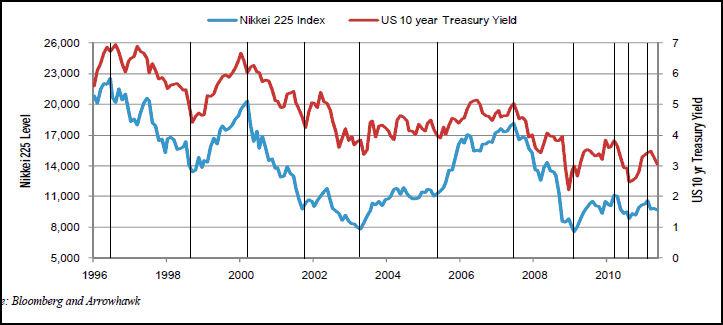
This later condition is exactly what we see during the last 15-1/2 years in the price action of the Nikkei 225 and U.S. 10-Year T-Note yields. The mirror image nature of the peaks and valleys in these markets is too similar to ignore, as seen below. I am sure those of you who are macro-economists can explain why these two markets are joined at the hip.
The above chart indicates that a bullish Japanese stock market play will work like a bearish U.S. T-Note play (short price, long yield) — that both sides of a long Japanese stock market and short T-Note price hedge could make money. The question is: Do the charts indicate the timing is right to probe this play? The answer is yes!
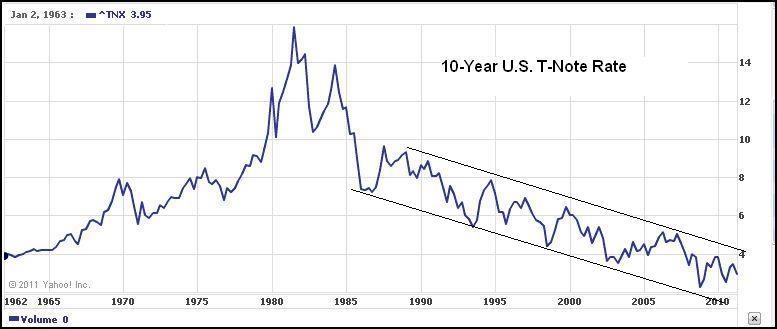
The chart below shows that the yield of the 10-Year T-Notes has been in a declining yield trend since the early 1980s. The chart displays a 24-year channel.
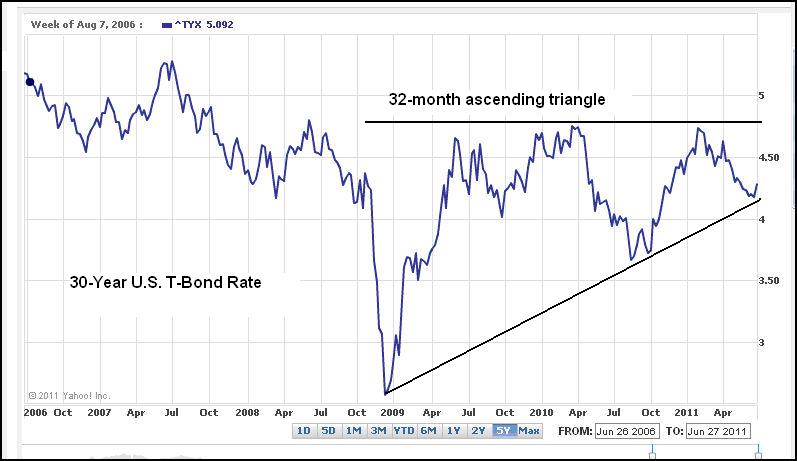
The 30-Year T-Bond yield chart (below) shows a possible 32-month ascending triangle. Keep in mind that a bear position on Bond prices is equal to a bull position on Bond yields. An advance by yields above 4.85% would decisively complete this triangle and establish a yield target of 6.8%. There is a chance that the June 2011 yield low of 4.17% is the final low of this chart configuration.
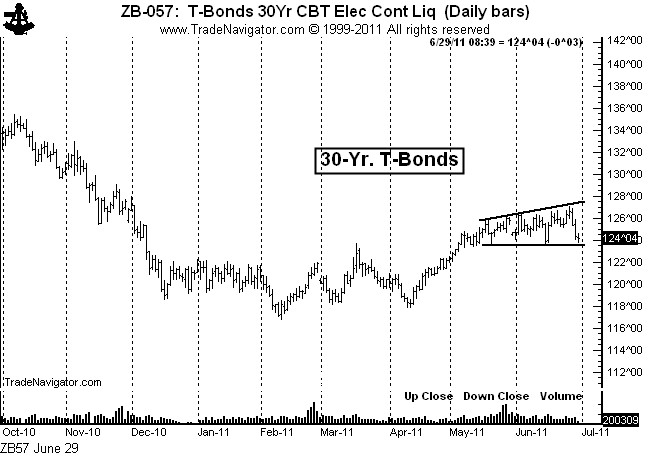
A chart of the CBOT Bond futures, $ZB_F, (reflecting Bond prices) is shown below. Note that this chart displays a possible right-angled broadening pattern. A close below 123-10 would complete this top.
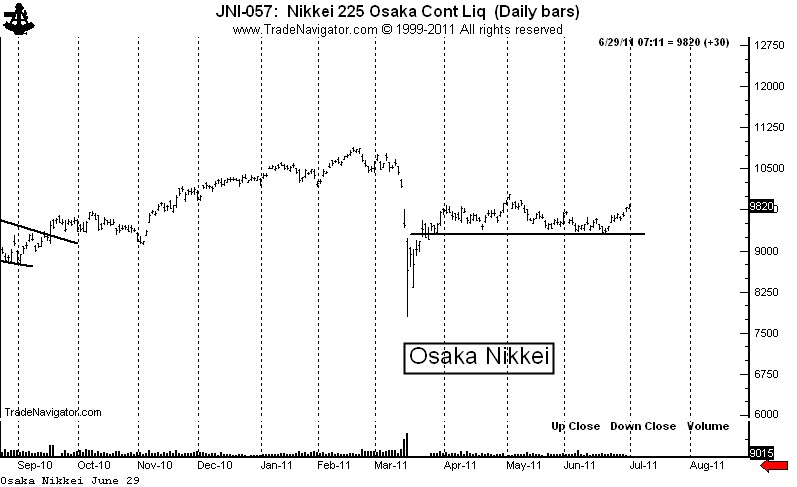
In the meanwhile, the Nikkei 225 futures chart ($JNI_F) shows a line of strong support at 9300. If this level does not hold, then the March “earthquake-” event low could be tested.
Position traders have very well defined risk points for being short Bonds prices and long the Nikkei 225. This position can be established using futures (Board of Trade for Bonds and Osaka for the Nikkei) or with a number of ETF combinations. The ETF alternatives are
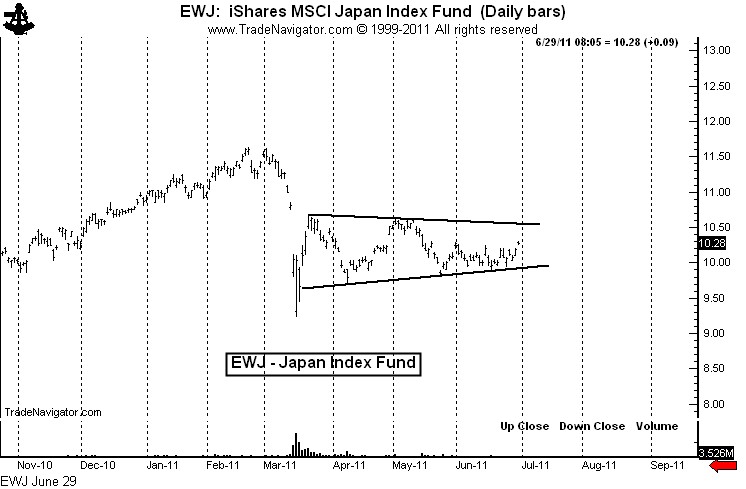
- Long $EWJ (Japan Index) – see chart below
- Long $SCJ (Japan small cap)
- Watch for a new Nikkei ETF being filed by Maxis (symbol not yet available)
- Long $TMV, a 3X ultra bear Bond ETF
- Long $TBT, an ultra bear 20+ year Bond ETF
- Short $TMF, a 3X long 30-year Bond ETF
- Long $TBF, a short 20+ year Bond ETF
- Short $TLT, a long 20+ year Bond ETF
I prefer being short the ultra-long ETFs to being long the ultra-shorts because of the time decay factor of the ultra ETFs.
Markets: $ZB_F, $EWJ, $TMF, $TBF, $TLT, $TMV, $TBT
Disclaimer: I am a technical chartist and do not take into consideration fundamental or macro-economic factors.
###
Silver — on its way to $20
/by Peter BrandtPrice pattern today almost a perfect image of 1980
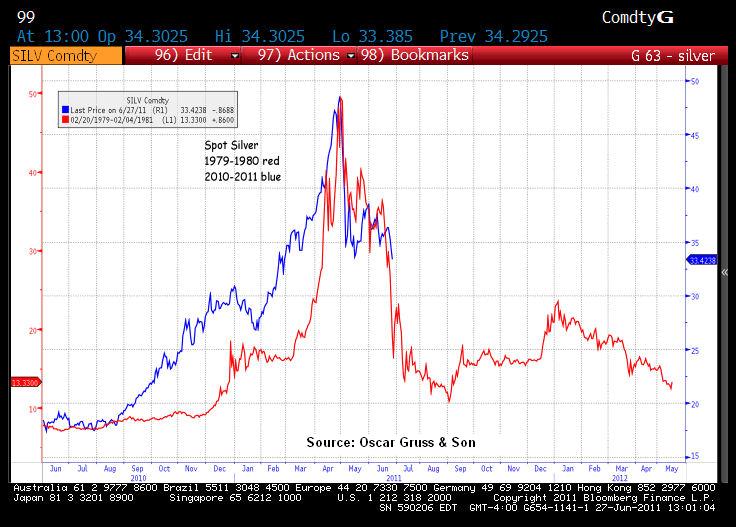
The chart below overlays the Silver today with the Silver price in 1980. The time framing and price scales are not identifical. It is the price pattern itself that is important.
Based on the price pattern, Silver today is following the script of 1980 with uncanny accuracy. And, based on the similarily of the patterns, Silver is headed to $20 to $25, probably by the end of the year.
Yet, a survey released Monday by Bloomberg indicated that the median expectation of 100 commodity analysts is for Silver to rally back to $49.79 by December 31.
I will trust history rather than the commodity analysts.
Markets: $SIL, $SI_F, $SLV
###

