A long-term look at the Japanese Yen charts
This content is for members only

The Public Blog site
Using slightly different charts of the same market produces different results.
Those of you who look at my charts on the blog or on Chart.ly might have noticed that I make wide use of nearby continuation charts in the futures markets. These are charts that plot only the nearest delivery contract. When one contract expires, the next contract month is then plotted on the same graph.
Even with the category of “nearby contract” charts there are differences. One approach is to plot the nearby contract until its expiration. Another approach is to follow the contract until first notice date. Yet a third approach is to drop the nearby contract when its volume shrinks below the next closest contract month. I use the third type most often.
Frequently the nearby continuation graph will give a different picture of a market than will the chart of a specific contract month. Take the current situation in Chicago Wheat.
Shown below is the graph of the July Wheat contract. This chart shows that the 10+ month H&S top was completed on June 16.

Yet, the H&S top on the nearby continuation chart has not yet been completed, as seen below.

I follow both types of charts — charts of the specific contract months and nearby continuation charts. It is by far my preference for the nearby chart to breakout first. I am always suspect of a market when a breakout by a specific contract month is not confirmed by the nearby chart. Many of my most profitable trades over the years have come from markets in which the nearby chart led the way.
###
There are a few charts that really have my attention right now — although that does not necessarily mean I have a position or will enter a position in these markets. It does mean that I have a position or am looking at strategies to establish a position in these markets.
First, Crude Oil. I have commented several times in recent weeks via this blog or on Chart.ly on the recent consolidation zone. It now appears as though a descending triangle is being completed. Look for confirmation, but be aware that a bear trap could also occur. This is one of those patterns that could provide a head fake to the downside but provide big profits on the upside. But for now, I am short in my proprietary account with relatively tight stops.

Next, I will focus on one of the best potential chart set ups I have seen in a year or so — Natural Gas. The January 2012 contract displays a classic H&S bottom on both the daily and weekly charts. A major bottom is being constructed in this market. I am sure I will comment many times on this pattern and the trading implications in futures and ETFs. [Note: Dan Chesler, an excellent energy market analyst, brought this chart to my attention. Dan’s web site is www.chesler.us]


Next, Copper. I have been bearish on this chart for weeks, but the market is making it hard for position traders who sell weakness. Yet, the market is rolling over. What appeared to be a bear flag has now turned into an awkward 5-week continuation H&S pattern. If the trend has really turned down prices could easily drop $1 per pound in two months.

Next, Soybean Oil. I have had an upward bias in this market based on a possible continuation inverted H&S pattern. However, a sharp drop would complete a H&S failure sell signal. Also, the closing price chart (and I am paying more attention to closing price charts because of increased market “noise”) has completed a symmetrical triangle top. I am presently short Bean Oil, but I will remain flexible.


Next, July Chicago Wheat. If there ever was a H&S top pattern for the books, this is it. The problem is that H&S tops are supposed to occur after a large move up (i.e., tops are supposed to reverse a previous trend). This pattern does not qualify for this criteria in that the pattern itself WAS the move up. Nevertheless, this is a facinating chart worthy of following. I may or may not go short Wheat.

Next, July Silver. This market is in a major bear trend. The daily chart completed a H&S failure pattern on June 13 when the June 3 low was penetrated. I want to make a MAJOR point here, folks. I trade based on set-ups, knowing that 60% of my set-ups will fail over an extended period of time (over shorter time frames in the past, up to 80% of my signals have failed to produce profitable trades). I comment on set-ups, not on market opinions.
Finally, DYY (the ultra long commodity ETF). I am engaged in a short-selling campaign in this ETF. See previous posts here and here. I will pursue the strategy I have already disclosed. I am short two layers of DYY and will short a third layer if the H&S top is completed.

That’s all for now, folks.
Symbols related to this post: $ZW_F $DYY $NG_F $ZL_F $SI_F $SLV $CL_F $DJP $SIVR $GAZ $DBA $UNG
Disclaimer: I am a pure chartist. I do not trade based on fundamental or macro-economic factors.
###
A trade with a $10 to $1 reward/risk relationship
Major reversal patterns are predominant in all global commodity indexes. The ETFs offer a trading opportunity with a $10 to $1 reward/risk relationship. I will take these types of measured-risk trade set-ups all day long.
Background
As shown by the long-term CRB Index, global commodity prices have been in an historic bull trend, with the Index advancing 107% from the late 2008 low and 269% from the 2001 low.

There is an old adage that, “Nothing cures high commodity prices like high commodity prices.” High commodity prices provide an incentive for manufacturers to find alternative and lower-cost production methods/components and for producers to bring new production on line.
There are some signs that commodity prices are overextended – and that significant price retracements are possible. In fact, H&S chart formations are appearing in all commodity-based ETFs.
Below is the daily chart of the iPath Dow Jones-UBS Commodity ETF (symbol: $DJP). A decisive close below $47.00 would complete this top and establish an initial objective of $41.64.

The ELEMENTS Linked to the Rogers Commodity Fund (symbol: $RJI) also exhibits a H&S top pattern. A decisive close below $9.20 would set a target of $8.15. Note on the charts of $DJP and $RJI the appearance of large down gaps on May 5. That these gaps have remained open is a sign of weakness.

Laying out a trade
I will attempt to establish a short campaign with a reward/risk relationship of about $10 to $1 using selected commodity index ETFs. Keep in mind that the sizing stated below is per each $100,000 of trading capital.
The London Stock Exchange trades a short commodity ETF, symbol $SALL (quoted in US$). I will buy 300 shares of SALL at $52.12 stop. My risk on the trade is $.80 per share, or a total of 24 basis points ($.80 per share times 300 shares equals $240). The target would be $57.80. If reached, my profit would be 170 basis points (or $1,704 per $100,000 of trading capital).

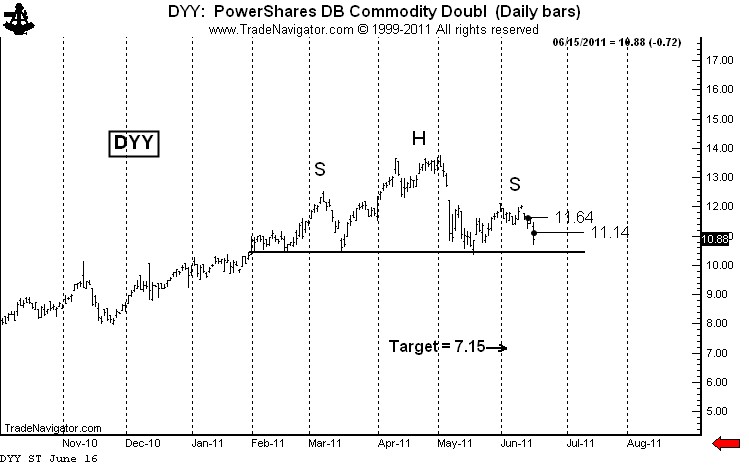
I will also short the Ultra 2X PowerShares DB Commodity Index ETF, symbol $DYY. I like the concept of being short the ultra-long ETFs because prices will erode if the underlying commodities drift sideways. Shorting an ultra-long ETF is similar to shorting an out-of-the-money call.

I have shorted the first layer of 200 shares today at $11.64 with a risk to $12.75 (22 basis points). I will short the second layer of 200 shares below the existing June low at $11.24 stop. If filled, I will risk the first layer to $12.22 (12 BP) and the second layer to $11.81 (11 BP). So, after two layers are established my total risk on $DYY will be 23 BP, or $230 per $100,000 of trading capital.
I will short a third layer of 200 shares of $DYY at $10.14 stop, and if filled I will risk my entire position to $11.06. This would lock in a profit of 11 BP in layer one and 3 BP in layer two. The risk on layer three would be 18 BP. The composite risk on all three layers of $DYY at the point of entry of layer three would be 4 BP.
The target of $DYY would be $7.15. If all goes according to the plan (and this seldom ever happens), my profit on the three layers combined would be 231 BP ($2,310 per $100,000 of capital).
I would anticipate that $SALL would be filled on the same day (+/- one day) as the third layer of $DYY. If all goes according to the plan, my maximum risk will be about 30 BP, or 3/10th of 1% of capital, and my profit potential is about 400 BP (or 4% of capital). Thus, my reward/risk relationship is at worst $10 to $1.
NOTE: If commodity prices rally from present levels and the symmetry of the H&S patterns is disrupted, then all aspects of this analysis and trading strategy will be nulified.
###
Silver is also setting up for a sell signal.
I last commented on Copper in a June 1 post titled, “Major chart top in Copper – Target is 360.” The bear flag identified in that post appears poised for completion. A move and close below the June 2 low of 403.25 (July contract) would put the finishing touches on the red metal. The chart below is a closing price chart — the close-only flag would be completed today by a close below 408. Such a close would have initial targets of the May 12 low at 385.35 and the November low at 360 to 365. The diamond top projects to 363.

In my opinion, if Copper has really rolled over (if the bull trend from the December 2008 low has run its course), the most likely target for a bear thrust on the weekly chart is the 2010 low at around 276. The bull trendline on the weekly log chart has been penetrated. Keep in mind that the violation of a trendline is not a signal in my trading, but simply indicates a change in a market’s behavior.

Selling Copper on weakness has not been a profitable manuever. If the flag is confirmed, Copper should be shorted on 700 to 800 point rallies.
A postnote on Silver. This market is setup to signal a H&S failure. I will short Silver if the June 3 low at 3506 is penetrated, risking about 50 basis points.

###
The chart of July Soybeans is very instructive for traders using classical charting principles (Edwards and Magee or Schbacker).
As a starting point, no two classical chartists may label a chart in the same way. And even if some classical chartists agree as to pattern identification, it does not mean that:
I had labeled the July Soybean chart as a 16-week symmetrical triangle. By the way, the morph rate on symmetrical triangles is quite high. Nevertheless, the pattern was mature enough that I bought the breakout on June 2 at 1402. My initial stop was based on my Last Day Rule principle (see Diary of a Professional Commodity Trader book for an explanation of this rule). The LDR price of 1383.6 was violated on June 7, stopping me out. I lost about 50 basis points on the trade.

I still have the chart labeled as the same symmetrical triangle, and view June 2nd and 3rd as a premature breakout — although the breakout could prove to be a bull trap of significant magnitude. I will receive a secondary completion signal if the market can clear the June 3 high at 1419.4 or close above the upper boundary line of the triangle (about 1404). As of this writing, July Soybeans are trading at 1402, not high enough to trigger an entry signal. If an entry signal is generated at the close, the new Last Day Rule will be the low of today at 1385.
I will go long on a secondary completion of the pattern with a risk of 50 basis points (1/2 of 1% of capital). If I go long again and get stopped out, I will no longer follow this market. I give a pattern two chances for a clean breakout.
There is another lesson in this market. I have recently written about my dismay with high/low bar charts because of the noise factor. I have a strong bias in favor of closing price charts. On a closing price chart, August Soybeans completed the symmetrical triangle on June 2, but has not violated the pattern. A close below the May 31 close at 1372 would be required to violate the pattern.

Using closing price charts raises the subject of not using intraday stops, but rather using “stop-close-only” orders (real or mental). I discussed this idea in my blog posts titled “Lessons from a difficult year of trading” on May 24 and “Stops or no stops – a response to StockSage1” on May 25.
From a tactical point of view, using close-only stops (or much wider intraday stops) means that a trader must downsize his or her leverage or sizing in order to limit the risk of a trade to a certain basis point loss. Ideally, while the profit potential per winning trade would decrease with smaller sizing, the win/loss ratio would improve over an extended period of time in a manner to hopefully offset the lower leverage per trade.
Well, that’s my brain drain on this subject for now.
###
![]()
