Great blog post on charting by MercenaryTrader.com
This content is for members only
The Public Blog site
Risk On – Numerous charts show signs of a pending decline
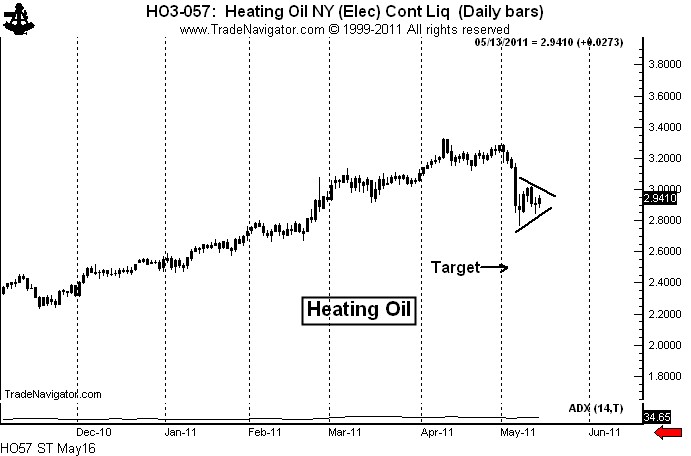
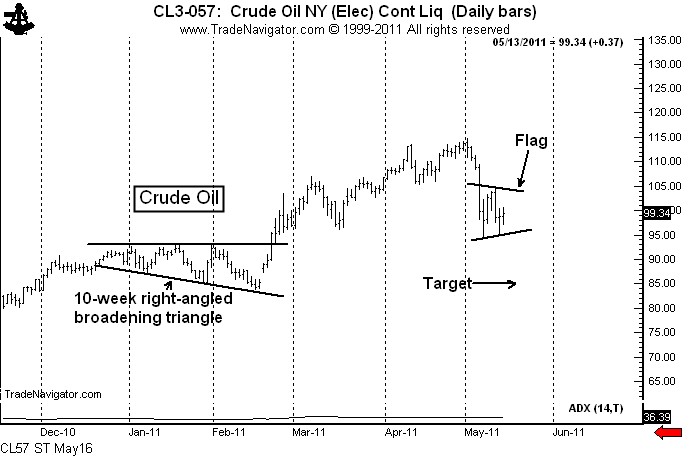
In the markets, as in real life, flags flying at half mast symbolize death. A number of half-mast flags and pennants in the raw material markets indicate that the steep decline in early May was just Act 1 in a two-act play. The flags are symbolic of the intermission between the Act 1 (the first decline) and Act 2 (the next phase of the bear trend).
Bear flags or pennants are present in the following markets:
Crude Oil and Heating Oil display classic pennants. Rallies toward the May 11 high (while not necessary) would be an excellent shorting opportunity. The target of the pennant is Crude Oil is 84.80.
The target in Heating Oil is 2.5060.

The Gold displays chart construction similar to the energy products with two exceptions. First, there is potentially enormous support under the Gold market in the form of a previously completed 4-month continuation inverted H&S pattern. However, old support sometimes has a way of disappearing. Second, the huge volume on May 5 could indicate accumulation buying by strong hands. However, if the energy pennants lead to a strong decline it will be difficult for Gold to hold up in a Risk On/Risk Off market environment.

Sugar also displays a classic bear pennant. This market is in a well-established bear trend and has been since early February. Notice that the pennant in the October contract is forming just below the neckline of a 5-month H&S top. The target in October Sugar is 17.83.

If my analysis is correct in Soybean Oil, the current pause in the form of a flag should be the last support before a sustained markdown in price. Once this flag gives way, prices should trend to 45.60. (Caveat: The pattern in Bean Oil could prove to be an extremely bullish continuation H&S pattern. Traders need to be flexible on this one.)

Additionally, a number of other markets present technically bearish potential. These markets include:
The Russell 2000 is hovering right at the major 8+ month trendline. A violation of this trendline would indicate that the bull trend since March 2009 is seriously aging. The initial target would be 770 as part of the transition from bull market to bear market.

A confluence of technical developments can add to the legitimacy of a breakout. There are four factors that could trigger a sell signal in the S&Ps simultaneously by a decline below the May 6 low. First, the 2-month cup and handle bottom would fail; second, the 2-month trendline would be violated; third, the May 2 Ben Laden blow-off would be confirmed;

and, finally, the hourly chart symmetrical triangle would be completed.

I touched the third rail in late April when I announced that Silver was in the bubble phase. I was tarred and feathered on May 1 when I pronounced the previous week’s volume (7.5 years of global supply) was a strong sign that Silver had topped. The market has found support in the low 30s and a bounce into the low 40s is possible as Silver develops its own half-mast bear pattern.

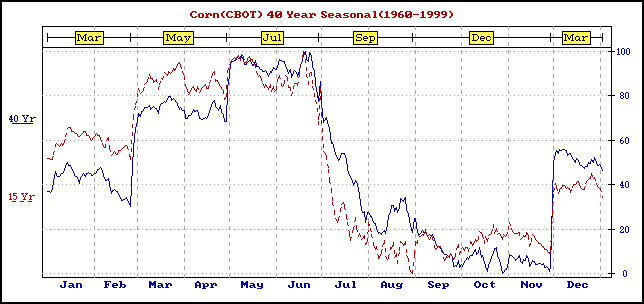
New crop December Corn has traced out a H&S top. It would not be unusual for Corn to top now.

The seasonal chart shown indicates a strong tendency for new crop Corn to top in May or June.

Finally, the daily chart of August Soybean Meal displays a very clear possible descending triangle. A close below the recent lows would complete this pattern and establish a target of 300.

Adding all things up, the period just ahead could be a tough life for raw materials (and stocks).
###
The S&Ps have a possible top
When it comes to classical charting, it is always best when a multiplicity of developments occur. Such is the case in the S&P right now. There are three (if not four) chart developments that could support an important change in trend.
FIrst, the late April breakout from the 9-week cup and handle pattern has not resulted in follow through. The top of this pattern was tested hard on May 5. A move below the May 5 low would be a failure of this pattern. Possible strike 1.

Second, the daily chart displays a trendline from the March low. While I am not a big fan of trendlines, when a trendline violation occurs simultaneously with other developments it grabs my attention. Possible strike 2.
Third, the intraday chart displays a clearly defined 5-point symmetrical triangle top. Possible strike 3.

Importantly, a decline below the May 5 low would complete all three developments. There is one other important technical factor worthy of note. The Ben Laden top now appears to be a clear blow-off. The market has been unable to trend back into the range of this reversal day.
I will short this market if the May 5 low is penetrated. The target would be 1243. I remain long the Nasdaq from April 20– and am very close to being stopped out of that trade.
###
Just for fun, yesterday I did a snarky post on a very short-term “pie-in-the-sky” forecast for Silver. I called for the bounce to stop between 39 and 42 (actual high was 39.47) followed by a decline to below 33, then a rally to 42. The lines on the chart below were drawn yesterday morning.

So far so good. Pure luck…if I am right it will be pure luck. A wild guess! A hail-mary pass! I admit it. Of course, I am far from right yet. Alot can happen. The Silver market (and any other market) can do anything it wants to do whenever it wants to do it and it would not surprise me. The Silver market is NOT accountable to my whims or wishes or wild guesses.
I had a number of folks challenge my forecast, wanting to know on what technical or chart basis I would come to such conclusions.
I have no idea if I will be right — like I stated above, I was taking a wild swing in the dark — but I will share with you my reasoning (right or wrong).
My price scenario was based purely and soley on what I thought the market had (has) to do to most severely punish Silver bulls, more specifically, Silver bulls that are long above 40 per oz. My secret is out! I have told it all. My market call had NO basis in technical analysis. Period! My career as a classical chartist is over. I have sinned against my craft. I created a scenario that was based on what I thought the Silver market could do to most demoralize the johnny-come-lately Silver bulls.
I could have also created a price scenario of what I think the Silver market could do to most severely punish the Silver bears. Perhaps I will share this in the days to come. Perhaps a “punish-the-bears” scenario is the real agenda of the Silver market.
The truth be told, I could care less which scenario comes to pass. I have no vested interest in Silver. I am a trader. I trade price, not market biases, not fundamental scenarios, not Fed doomsday events, not the future value of the US$. And by the way, the last time I checked the U.S. Dollar is not traded in the Silver pit. Never has been. Never will be. There is an actual contract for trading the Dollar.
That’s all for now, folks.
###
Most chart patterns fail and then morph into larger patterns in a process I call “redefinition.” This is especially true of intraday charts. They are extremely unreliable.
With this in mind, here is my best guess on the short-term chart structure of Silver.
On the daily chart, a major top is in place. I keep hearing people talk about waiting for a decent break to buy — about catching the next upleg in the market. Unbelievably, many “investors” are still bullish on Silver. To me this is a gigantic red flag. Conventional wisdom (i.e., the prevailing view of the marketplace) holds that Silver is in a significant correction within a much larger bull trend. The bias of investors (those not wiped out by the first decline) is to be long.
What we know for certain is that a parabolic move ended in massive record volume in Silver trading (futures and ETFs). This is a sign of a top. The burden of proof is on the bulls. In fact, should the market rally and make a new high it would be one of history’s great shorting opportunities. People have attempted to convince me that Silver was not in a parabolic move. WHATEVER!!!!!

Make no doubt about it, Silver has topped. If it has not topped, it will be many, many months before a legitimate bull trend can re-emerge.
Short term, the hourly chart displays an advancing channel. I believe that a bear market correction to the $39 to $44 zone is possible, but not on this leg up.

More than likely the market will have a further downward correction, perhaps even making a new low for the decline, before a more serious rally into the low 40’s can occur. From a market psychology standpoint, a decline to the low 30’s followed by a rally into the low 40’s would get the bulls all excited again — just in time to be slammed once more.
Then the market should drop into the mid 20’s.
Full disclosure: I have no position. I have no bias to defend. I don’t really care where Silver goes. I am perfectly ok if Silver goes to 5 or to 100. I don’t care if my next trade is short or long. I only care that sometime in the next 12 months the Silver market will give two or three low risk/high reward chart setups.
###
Three reasons why Silver might be close to a temporary bottom (within a larger bear market).

I left out an important part of history in yesterday’s post on Silver…that is, the origination of the phrase: “When the cops raid the brothel, everyone is arrested, including the piano player.”
I first heard this phrase at the CBOT in early 1980 in direct reference to the Silver market collapse. On the chart below you will note that Silver topped at 5056, dropped quickly to 3025, recovered to 3970, then was destroyed to 1080 and eventually 4 (that is $4 per oz.) for a total decline exceeding 90 percent.

The reported reason for the decline was the failed attempt to corner the physical market by the Hunt brothers of Texas. Today’s equivilant would be a combination of JP Morgan and the small speculators through the ETFs. The CFTC stepped in January 1980 and hiked the margin requirements. The rest was history.
The real reason for the decline was that Silver had no business being at $50, that Silver is a COMMODITY, and that commodities have boom and bust cycles.
Many, many investors got wiped out by the drop. During a meeting at the CBOT, a member made the statement, “Isn’t it too bad that not only the Hunts got wiped out, but little investors who had nothing to do with the manipulation also lost the family farm.”
To this comment, and old-time trader made the statement…”Well, you must remember, when the cops raid the brothel, everyone gets arrested, even the piano player.” I will never forget the phrase or the meaning of the phrase.

By the way, the conventional wisdom during the advance of 1979 (extending far into the 1980s) was not much different than it is today. Inflation concerns, worries about fiat currencies, fed policy, etc. These were the reasons the small investor bought Silver then and the reason they bought Silver in this cycle. Margin call after margin call later, the small investor always plays the role of the piano player.
By the way, a good way to play Silver in stocks is to short the ultra long, AGQ. Of course, pick your spots and use stops. Even if Silver develops into a broad trading range, AGQ will decline.

###

Silver prices cannot go down, after all, the US$ remains weak! The fed is out of control…inflation is brewing…my macro model calls for further gains…China is still buying…my canary is sick…my mother-in-law bought a new Honda, etc., etc., etc.
This is all I heard as a result of my posts on Silver in the past week. Now, I want to be cautious not to crow, because those who crow end up eating crow down the road.
But the reality is this — Silver is a commodity. As a commodity, Silver is subject to boom and bust cycles, just like Sugar, just like Soybeans, just like Coffee. There is nothing special about Silver. Do you believe me yet?

Let’s put this decline in Silver into perspective. An $11 break in Silver is worth $55,000 per Comex contract. This is equal to a $550 move in the price of Comex Gold, an $11 move in Soybean prices, a $2.20 move in the price of Copper, a $1.46 move in Coffee prices…should I go on?
The Silver market presently is about one thing and one thing only…margin call liquidation. Silver prices have nothing to do with everything people told me would drive prices higher. Silver prices are about thousands of small speculators long above $45 per ounce.
The commodity market behaves like a living, breathing entity. The market instinctively knows when a group of investors are in trouble. And when a group of investors are in trouble, it is like a brothel raided by cops. Everyone gets arrested.
This phase of liquidation will not last forever. But it will last until every small speculator long above $45 per ounce is forced to liquidate. Every last one. Only then will Silver be able to experience a sharp counter-trend bounce. But make no doubt about it, the bounce will be counter-trend. When the bounce occurs an entirely new group of investors will jump aboard thinking the bull market is once again alive and well. These investors, too, will end up in a brothel raid.
###
There are a lot of you out there on StockTwits.
I get more questions via email from traders like you about the managed futures/forex world than about any other subject. It seems that a lot of you aspire to manage money in stocks, futures or forex.
While I mostly have been a proprietary trader through the years, I do know a lot about the managed futures and forex space within the alternative investment category. A number of the other StockTwit bloggers know the ins and outs about managed funds from the stock market perspective (knowledge I do not possess), such as my friends Joshua Brown at TheReformedBroker and Derek Hernquist, Howard Lindzon, Dragonflycap, Quinttatro, johnsontrades, valueplays, and joefahmy.
I was a trader in the 1980s and early 1990s with Commodities Corp. (CC), the original multi-trader futures and forex prop house. My performance during those years for CC was acceptable, but not great – 18.52% AROR, no losing years, worst drawdown of about 10%. Frankly, I was a boy among men at Commodities Corp. CC launched the trading careers of the superstars – the guys you read about in Market Wizards. I do not place myself in their league.
Consider this post to be the first of many on the subject of managed futures and forex, what the industry is like and what steps you would need to take to qualify as a player. I think that you will be very surprised with some of the information I will share.
Presently about $290 billion is being managed in futures and forex. This is money dedicated to Commodity Trading Advisors (CTAs), as reported by Barclay Hedge. Other areas of the alternative investment category also have commodity and forex exposure.
I believe that within five years the managed futures space will grow to $1 trillion or more. It is the fastest growing subset of the hedge fund world. The opportunities in the next five to ten years are great for emerging traders that have the right stuff.
The ten largest CTAs manage $82.4 billion, or more than a quarter of all assets under management (AUM). You would think that these CTAs are superstars. Not so!
| Ten largest CTAs by Assets Under ManagementThrough March 2011 | ||
| Category | Average | Range |
| Assets Under Mgmt | $8.2 bil | $1.8 bil to $23.6 bil |
| 5-yr AROR | 7.86% | -3.23% to 19.27% |
| 5-yr worst drawdown | (11.09%) | (8.49%) to (29.43%) |
| 5-yr. Calmar ratio | .71 | -.11 to 1.53 |
| Duration of longest DD – peak to valley to new peak | 23 mos | 9 mos to 46 mos |
I want to note two things.
First, the performance of the largest CTAs is pathetic, in my opinion, although with a losing year going in 2011, I am a bit shy to be too critical. These CTAs receive huge asset infusions because institutional money flows to the big boys, despite their poor performance. CTAs with a long history, big staffs and huge AUM levels receive the assets allocated by pension funds, huge Commodity Pool Operators (CPOs), etc. The $100 million AUM level is the minimum for a CTA to be considered for institutional funding. The CTA with the most AUM ($23.6 Billion, that’s with a “B”) has a five-year AROR of 4.74%.
Secondly, I believe that the Calmar Ratio is the best measure of risk-adjusted performance (although the Sortino Ratio is not bad either). To determine your own Calmar, divide your compounded average annual rate of return by your worst month-ending peak to valley drawdown.
The managed futures industry is obsessed with the Sharpe Ratio, which I think is a useless measure, mainly relied upon by institutional money placers to justify poor performance. At industry conferences, such as the Altegris event in San Diego two weeks ago, investors and pool operators drooled during a presentation of the Sharpe Ratio. Yet, the Sharpe Ratio penalizes upside performance. A trader who holds his or her money together with solid risk management for 10 months, then has two wonderful months to make a year, would be murdered by the Sharpe Ratio.
Third, are you surprised by the duration of the longest peak-to-valley-to-new peak drawdowns? Would you have guessed these drawdowns would have been so long? The truth be told, even CTAs in which I have great respect experience long drawdowns.
In the next post I will focus on the performance stats of the CTAs I have selected for my own IRA funds. I want my IRA money in managed futures, traded by people other than myself.
###
![]()

