

Launching Patterns – Guest Post
Factor Trading is honored to be joining forces with my friend Aksel Kibar and his firm TechCharts to provide comprehensive coverage of global forex, futures and equity markets from the perspective of classical charting principles.
TechCharts will begin as a subscription-based service on May 22 — with a pricing discount for Premium Members of the Factor Service.
Our mutual mission is to alert members of the Factor Service and TechCharts to markets exhibiting those classical chart patterns with highest level of reliability.
In the weeks ahead Aksel will post material on the Factor web site so that you can sample the wonderful work he does.
Please see the recording of the video between Aksel and myself discussing this new association. Link Here
Peter Brandt
Launching Patterns
by Aksel Kibar
Chart patterns form over varying duration. On a weekly scale chart, a 3 month-long consolidation pattern can exist within say a year-long chart pattern. These shorter and longer duration chart patterns can have the same boundary lines and a breakout from the short-term chart pattern can also complete the long-term chart pattern.
In such cases the short-term chart pattern is called a launching pattern. Identifying a launching pattern can be important. Breakout from such consolidation periods will not only trigger a chart pattern breakout signal in the short/medium-term but also result in a long-term shift in the direction of the trend.
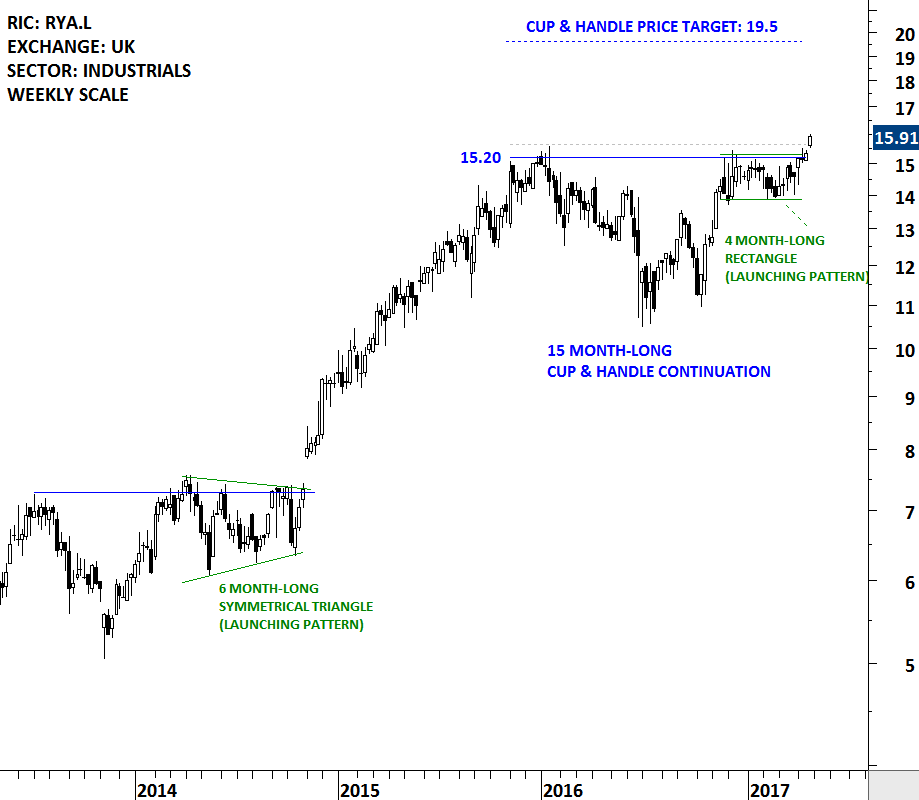
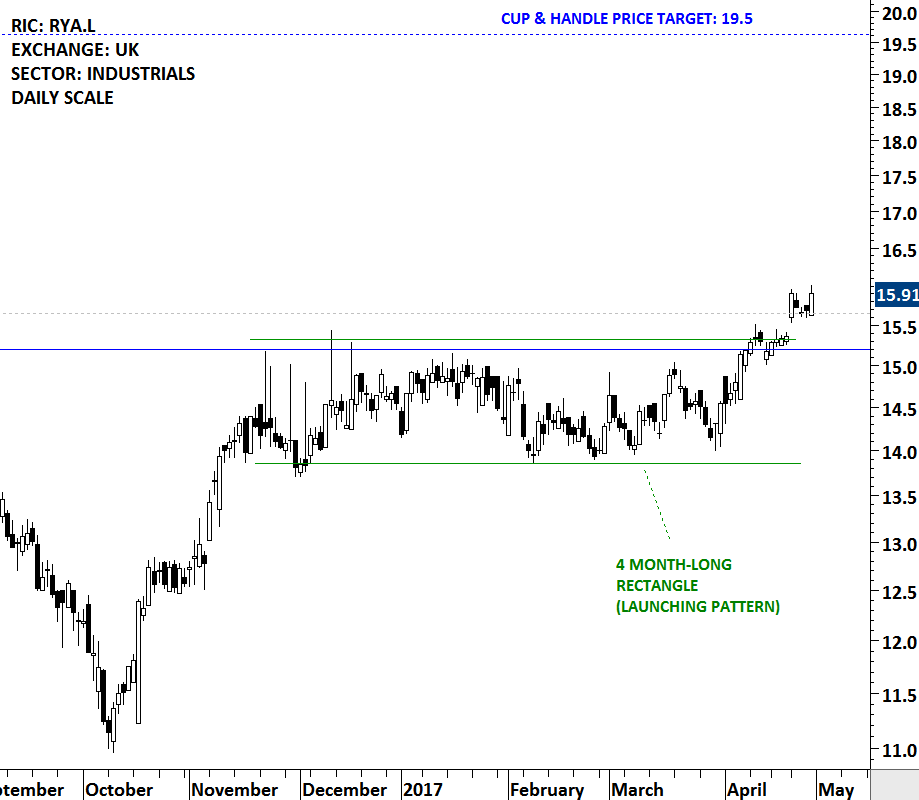
The weekly price chart of RYANAIR HLDG formed a 15 month-long cup & handle continuation chart pattern. The handle part of the bullish continuation chart pattern formed a separate 4 month-long rectangle consolidation. The rectangle continuation acted as a launching pattern for the larger scale chart development. Breakout from the 4 month-long sideways consolidation not only completed the rectangle but also breached the boundary of the 15 month-long cup & handle chart pattern pushing the stock to all-time high levels.
RYANAIR HOLDINGS PLC (RYA.L)
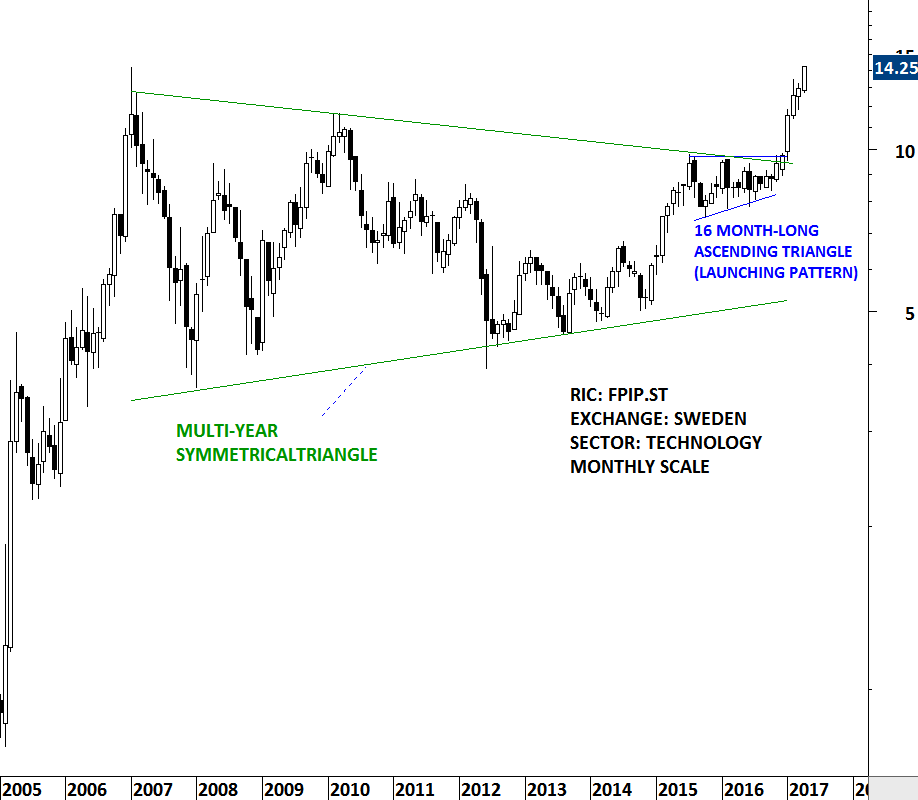
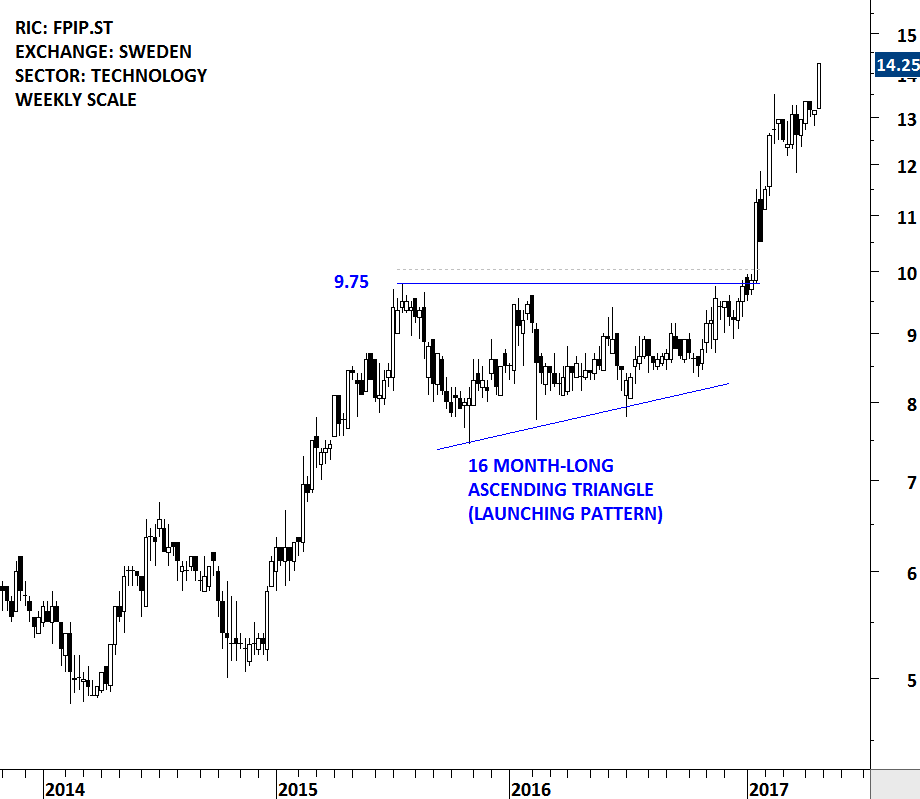
A similar chart setup developed in late 2016 on a Swedish Technology company FORMPIPE. A well-defined 16 month-long ascending triangle completed as a launching pattern from a multi-year symmetrical triangle. This was a massive long-term opportunity. Breakout cleared strong technical resistance between 9.75 and 10 levels. Tech Carts Global Equity Markets report highlighted the significant chart development in its January 21, 2017 report. Several updates on twitter showed the breakout and the trend that developed following the strong breakout.
FORMPIPE (FPIP.ST)
See this Educational Video I put together discussing rectangle patterns in classical charting and more relevant to this post, how they can act as a launching pattern.
Please visit my website at >>> https://blog.techcharts.net where you can sign up for free and receive my weekly Global Equities Market Report.
Regards,
Aksel Kibar


