Factor Trading is honored to be partnered with my friend Aksel Kibar and his firm TechCharts to provide comprehensive coverage of global forex, futures and equity markets from the perspective of classical charting principles. Below is a guest post I thought provided members of Factor and the wider community with great value.
Regards,
Peter Brandt
Ascending Triangle - Video Tutorial
by Aksel Kibar
Right angle triangles, with the hypotenuse slanting upwards from the origin of the pattern, are Ascending Triangle chart patterns and they are bullish.
The below educational video describes how to identify a bullish ascending triangle, along with some of the characteristics of this pattern that could help you identify and take advantage of such patterns within your own personal trading.
Factor Trading is honored to be joining forces with my friend Aksel Kibar and his firm TechCharts to provide comprehensive coverage of global forex, futures and equity markets from the perspective of classical charting principles. Please see the recording of the video between Aksel and myself discussing this new association. Link Here
Regards,
Peter Brandt
NOTE: Aksel Kibar’s Tech Charts Service will be launching its limited Founding Member offer this Monday May 22nd!
Richart W. Schabacker discussed the importance of chart patterns in the averages, in his book Technical Analysis and Stock Market Profits. He concluded that if many individual issues were to make strong Head and Shoulders formations at exactly the same time, the average chart would, obviously, show a similar Head and Shoulders. However, since the many different stocks do not, as a rule, make their ‘‘peaks and valleys’’ on precisely the same days, the average chart is likley to show a less specialized and distinct pattern. We should, for this reason, expect the averages to show Common or Rounding Turns more often than do the charts of individual issues at times of important reversals.
Most stocks sooner or later will follow the major swings of the market. Individual stocks in a sector or industry group might form similar chart patterns due to economic cycles or sector rotation. These individual stocks can be affected by other factors such as commodity prices.
One should stay alert and start anticipating a major shift in the direction of the trend after finding similar chart patterns developing in a specific sector or industry group. It is important to note that these chart patterns are usually well-defined on the individual stocks when compared with the chart patterns on the averages.
The video tutorial discusses what can be next for the European banks by giving examples from the two major trading themes in energy sector equities and mining companies.
https://www.peterlbrandt.com/wp-content/uploads/2017/05/Tech-charts-public-blog.jpg8221233Aksel Kibarhttps://www.peterlbrandt.com/wp-content/uploads/2026/05/The20Factor20Report-2-scaled.pngAksel Kibar2017-05-18 09:09:172017-05-18 09:10:47Long Term Charts – Video Tutorial – Guest Post
Factor Trading is honored to be joining forces with my friend Aksel Kibar and his firm TechCharts to provide comprehensive coverage of global forex, futures and equity markets from the perspective of classical charting principles.
TechCharts will begin as a subscription-based service on May 22 — with a pricing discount for Premium Members of the Factor Service.
Our mutual mission is to alert members of the Factor Service and TechCharts to markets exhibiting those classical chart patterns with highest level of reliability.
In the weeks ahead Aksel will post material on the Factor web site so that you can sample the wonderful work he does.
Please see the recording of the video between Aksel and myself discussing this new association. Link Here
The Cup with Handle is a bullish continuation chart pattern that marks a consolidation period followed by a breakout. It was developed by William O’Neil and introduced in his 1988 book, How to Make Money in Stocks. Cup with handle is a chart pattern that has a well-defined horizontal boundary. Breakouts from chart patterns with horizontal boundary are usually strong and reliable. As its name implies, there are two parts to the pattern: the cup and the handle. The cup forms after an advance and looks like a bowl or rounding bottom. As the cup is completed, a trading range develops on the right hand side and the handle is formed. A subsequent breakout from the handle’s trading range signals a continuation of the prior advance. Breakouts that complete a lengthy bullish continuation chart pattern and also record new all-time highs offer great long-term opportunity.
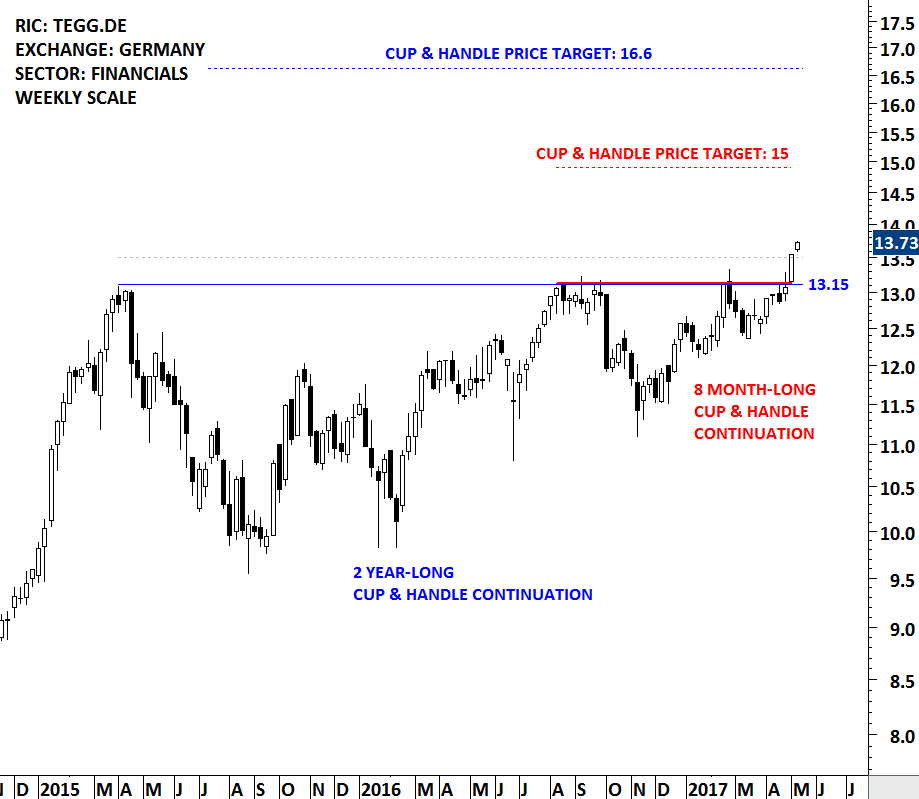
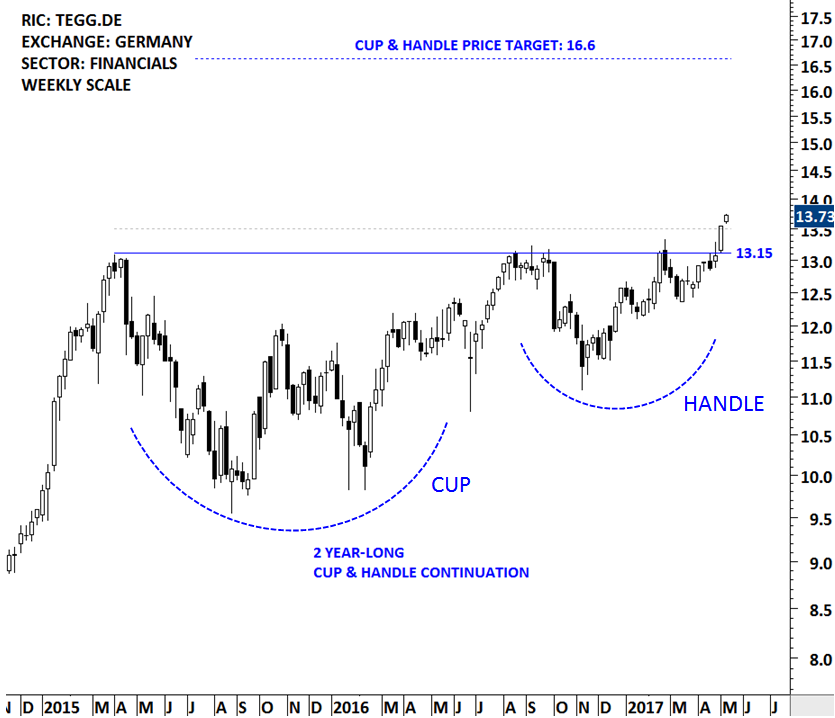
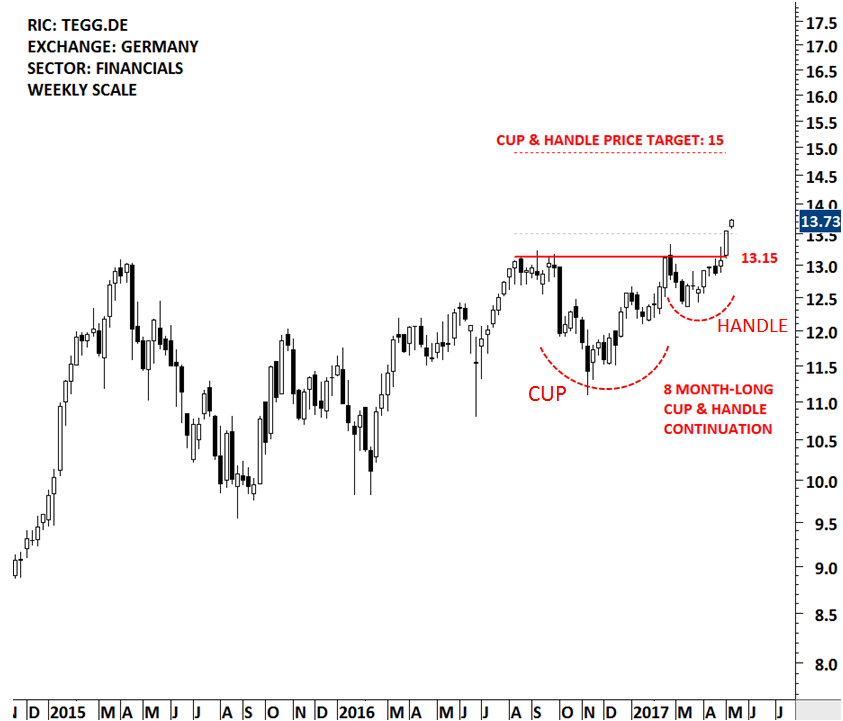
A 2 year-long cup with handle chart pattern formed on TAG IMMOBILIEN, a financial company listed in Germany on XETRA exchange. TAG Immobilien AG is a Germany-based real estate company that focuses on the acquisition, development and management of residential real estate. The geographical focus is on northern and eastern Germany, such as the metropolitan areas of Hamburg and Berlin, as well as on the Salzgitter and Thuringia/Saxony regions and North Rhine-Westphalia.
The stock not only formed a 2 year-long cup with handle chart pattern but also another shorter duration cup with handle chart pattern that is possibly acting as a launching pattern. For more information on launching patterns you can check out last week’s guest post here. (Launching Patterns – Guest Post May 2, 2017). When two chart patterns implying the same technical outlook overlap, the breakout is usually more significant. In this case the 8 month-long cup with handle and the 2 year-long cup with handle continuation chart pattern both suggests higher levels in the coming weeks/months. The daily close above 13.50 levels confirmed the breakout from the bullish continuation chart patterns. The breakout was featured in the Global Equity Markets – May 6, 2017 report. There are two possible chart pattern price targets. One calculated from the 8 month-long cup with handle and the other from the 2 year-long bullish continuation cup with handle. Charts below show both possibilities and how these two chart patterns are labelled. Initially TAG IMMOBILIEN can target 15 levels and possibly continue towards the larger scale chart pattern price target at 16.6 levels.
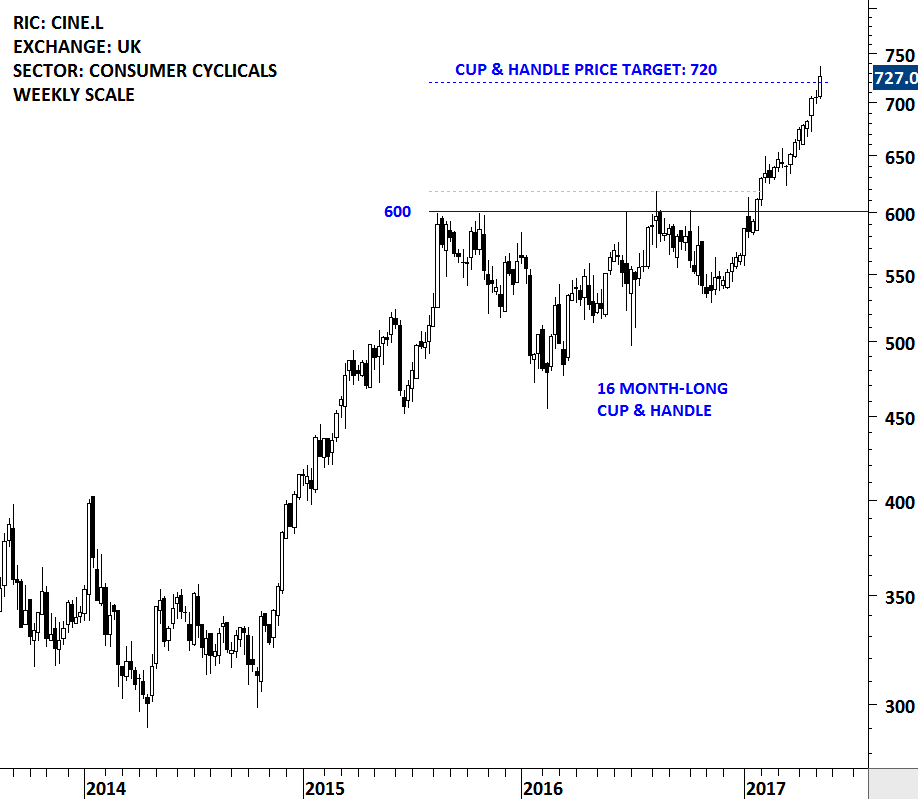
A similar chart pattern developed on CINEWORLD GROUP in the beginning of the year. The breakout and the follow through is a perfect example for cup with handle chart pattern.
CINEWORLD GROUP is a consumer cyclical company listed on the London Stock Exchange. Price chart completed a 16 month-long cup with handle chart pattern and broke out to all-time high levels. The stock was covered in the Global Equity Markets – January 21, 2017 report under the watchlist. The breakout took place in the following weeks with a strong weekly price action and it was alerted and featured on the Global Equity Markets – February 4, 2017 report. Since then, CINEWORLD GROUP has been in a steady uptrend. With this week’s strong price action CINEWORLD GROUP reached its chart pattern price target at 720 levels.
To learn more about Cup with handle chart patterns you can watch this video.
VIDEO :CUP & HANDLE – FRONTIER SERVICES
Please visit my website at >>> https://blog.techcharts.net where you can sign up for free and receive my weekly Global Equities Market Report.
Regards,
Aksel Kibar
https://www.peterlbrandt.com/wp-content/uploads/2017/05/Cup-and-Handle-Aksel-Kibar.jpg8231233Aksel Kibarhttps://www.peterlbrandt.com/wp-content/uploads/2026/05/The20Factor20Report-2-scaled.pngAksel Kibar2017-05-10 10:17:552017-05-10 10:18:34Cup and Handle – Guest Post
Factor Trading is honored to be joining forces with my friend Aksel Kibar and his firm TechCharts to provide comprehensive coverage of global forex, futures and equity markets from the perspective of classical charting principles.
TechCharts will begin as a subscription-based service on May 22 — with a pricing discount for Premium Members of the Factor Service.
Our mutual mission is to alert members of the Factor Service and TechCharts to markets exhibiting those classical chart patterns with highest level of reliability.
In the weeks ahead Aksel will post material on the Factor web site so that you can sample the wonderful work he does.
Please see the recording of the video between Aksel and myself discussing this new association. Link Here
Chart patterns form over varying duration. On a weekly scale chart, a 3 month-long consolidation pattern can exist within say a year-long chart pattern. These shorter and longer duration chart patterns can have the same boundary lines and a breakout from the short-term chart pattern can also complete the long-term chart pattern.
In such cases the short-term chart pattern is called a launching pattern. Identifying a launching pattern can be important. Breakout from such consolidation periods will not only trigger a chart pattern breakout signal in the short/medium-term but also result in a long-term shift in the direction of the trend.
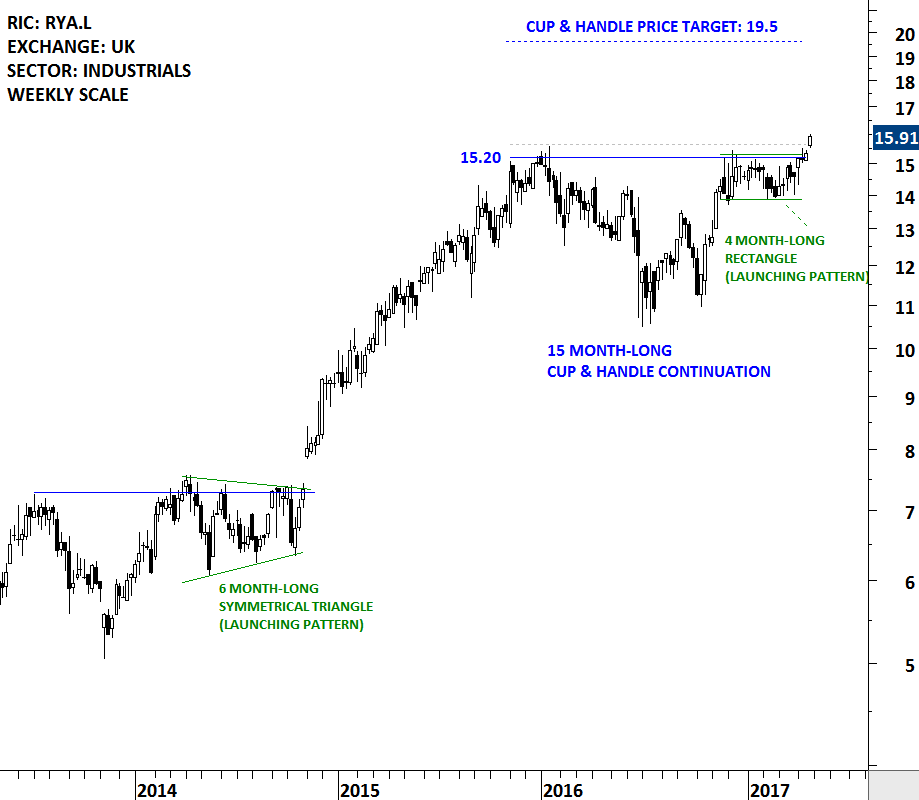
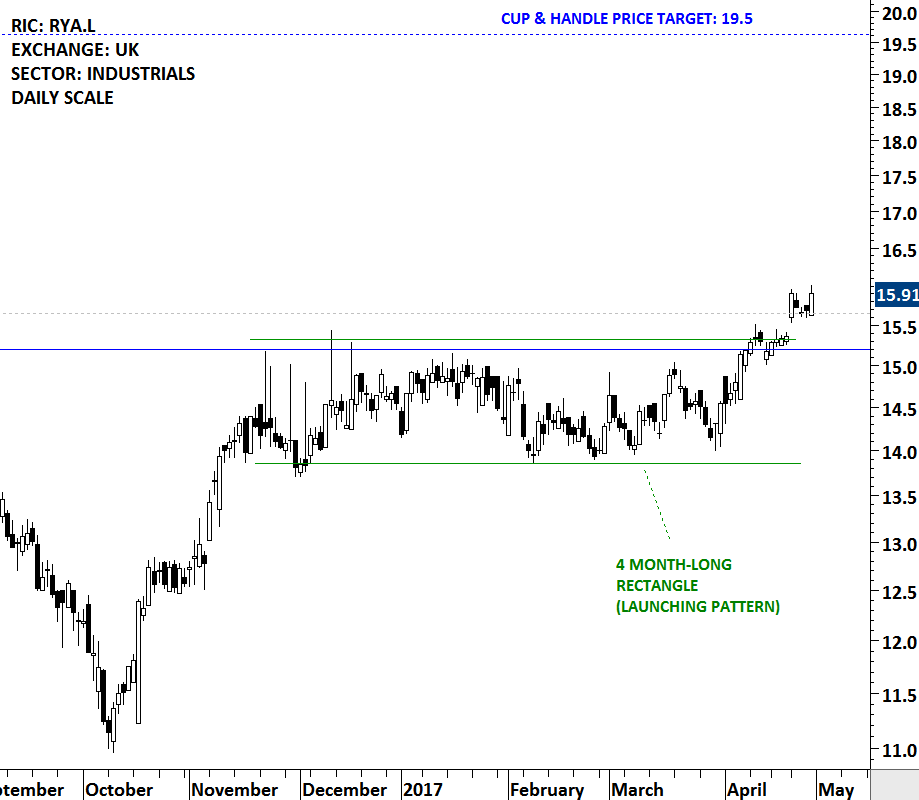
The weekly price chart of RYANAIR HLDG formed a 15 month-long cup & handle continuation chart pattern. The handle part of the bullish continuation chart pattern formed a separate 4 month-long rectangle consolidation. The rectangle continuation acted as a launching pattern for the larger scale chart development. Breakout from the 4 month-long sideways consolidation not only completed the rectangle but also breached the boundary of the 15 month-long cup & handle chart pattern pushing the stock to all-time high levels.
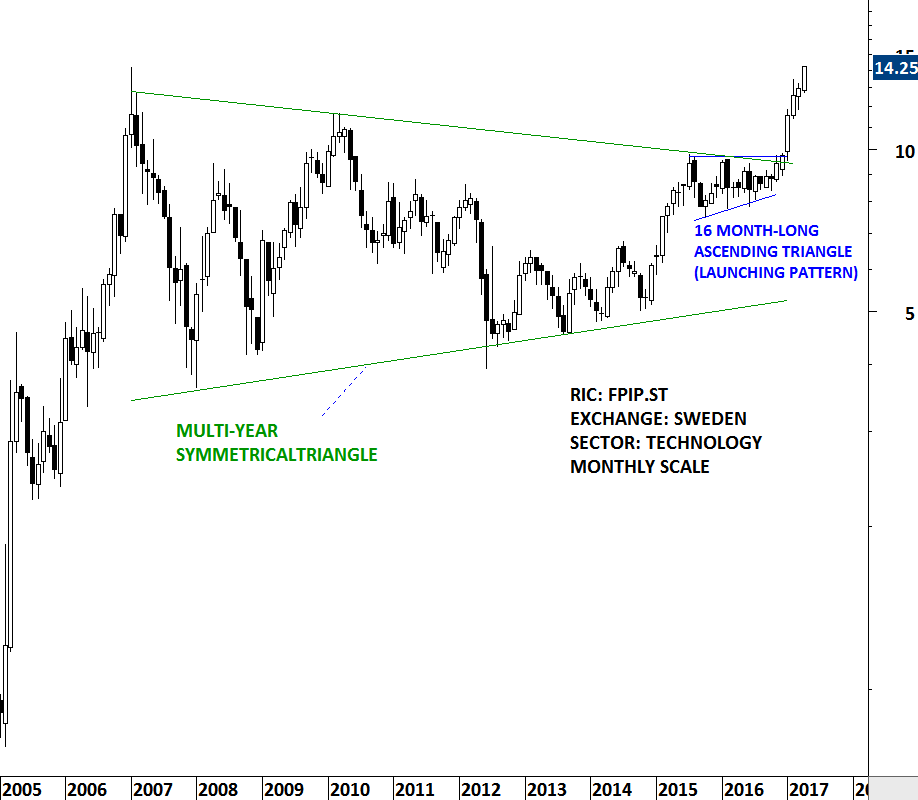
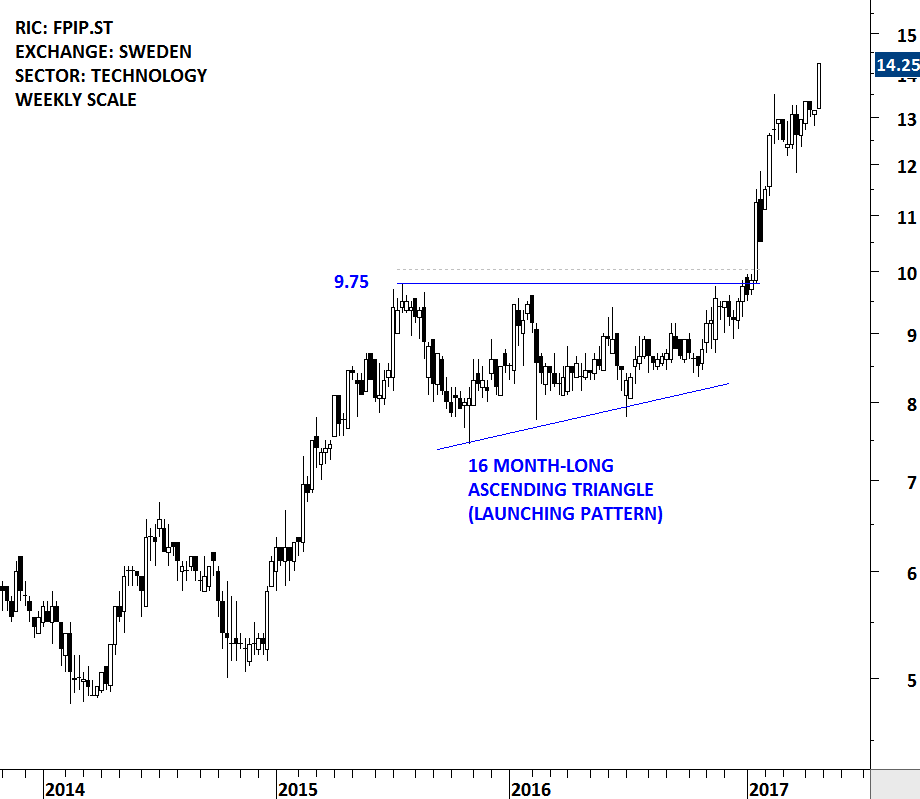
A similar chart setup developed in late 2016 on a Swedish Technology company FORMPIPE. A well-defined 16 month-long ascending triangle completed as a launching pattern from a multi-year symmetrical triangle. This was a massive long-term opportunity. Breakout cleared strong technical resistance between 9.75 and 10 levels. Tech Carts Global Equity Markets report highlighted the significant chart development in its January 21, 2017 report. Several updates on twitter showed the breakout and the trend that developed following the strong breakout.
See this Educational Video I put together discussing rectangle patterns in classical charting and more relevant to this post, how they can act as a launching pattern.
Please visit my website at >>> https://blog.techcharts.net where you can sign up for free and receive my weekly Global Equities Market Report.
Regards,
Aksel Kibar
https://www.peterlbrandt.com/wp-content/uploads/2017/05/Chart-Patterns-Aksel-Kibar-Techcharts.jpg7661150Aksel Kibarhttps://www.peterlbrandt.com/wp-content/uploads/2026/05/The20Factor20Report-2-scaled.pngAksel Kibar2017-05-02 16:16:392017-05-02 16:17:10Launching Patterns – Guest Post
Today I am extremely proud to announce the association of Factor Trading with Aksel Kibar’s – Tech Charts service. We recorded the below video yesterday to discuss the association and what members could expect from Aksel and the Tech Charts service. Below the video are details on how to follow Aksel and his service until the new service goes live. I encourage all to check out his global equity market reports.
plb
###
More About Tech Charts and Aksel Kibar
Aksel Kibar is a Chartered Market Technician (CMT) with more than 15 years of experience as a classical chart trader and global equity market analyst. He has worked for various companies throughout the GCC and MENA regions during much of that time.
Join his free mailing list and be alerted on when he publishes his free (until launch) Global Equities Market Report and all classical chart break out alerts. Sign up here: >> Link