Note: The post herein was absolutely wrong on the analysis of the H&S top in stock indexes. Guess what -- traders are wrong from time to time. I make bold calls and some are right and some are wrong. At the end of the day, price is king and nothing else matters. Members of the Factor research service know that I over-rode the analysis herein on January 6, cautioning that the stock market had deep internal trouble.
Classical charting principles have rules. The Head and Shoulders is a classical chart configuration. The apparent and well-advertised H&S top in the U.S. stock indexes do not meet the rules.
Perma-bears, a H&S top is not sitting for you under the Xmas tree!
Sorry to all of you stock market doomsayers, but labeling the U.S. stock index charts as H&S tops just does not work.
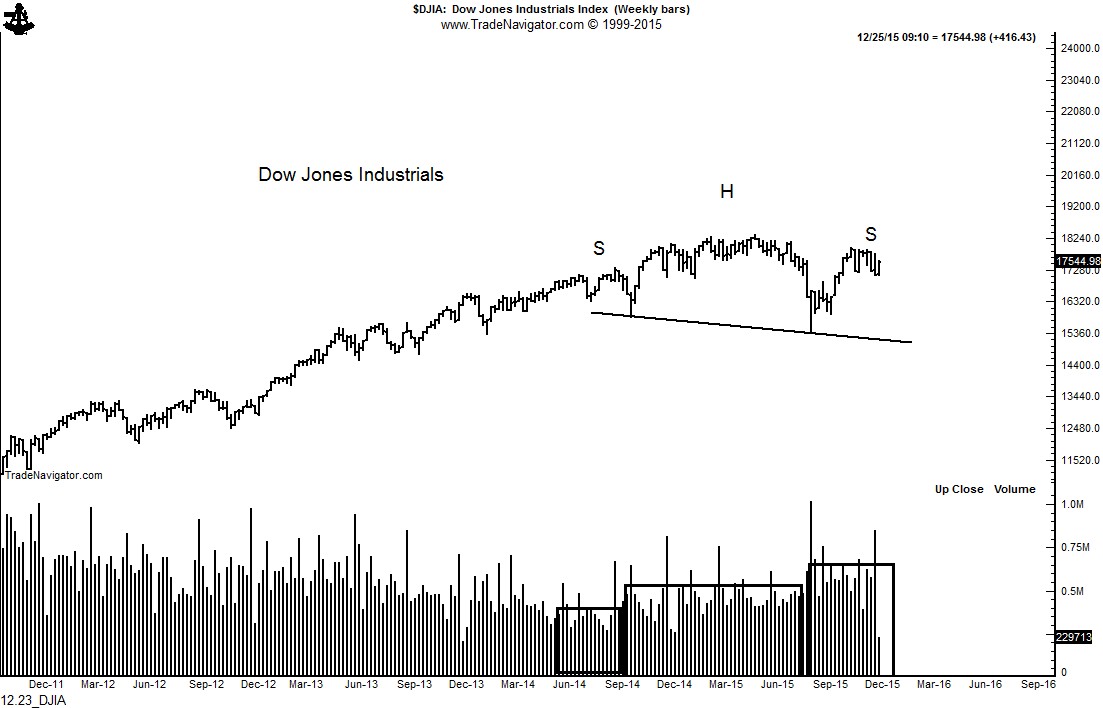
Volume is an important criteria upon which to judge the validity of the H&S patterns. Richard W. Schabacker (
Technical Analysis and Stock Market Profits), and later, John Magee and Robert Edwards (
Technical Analysis of Stock Market Trends), are considered the pioneers in classical charting principles. According to the founders of classical charting, as a rule volume should be greatest in the left shoulder or head and lightest in the right shoulder in order to validate a H&S pattern.
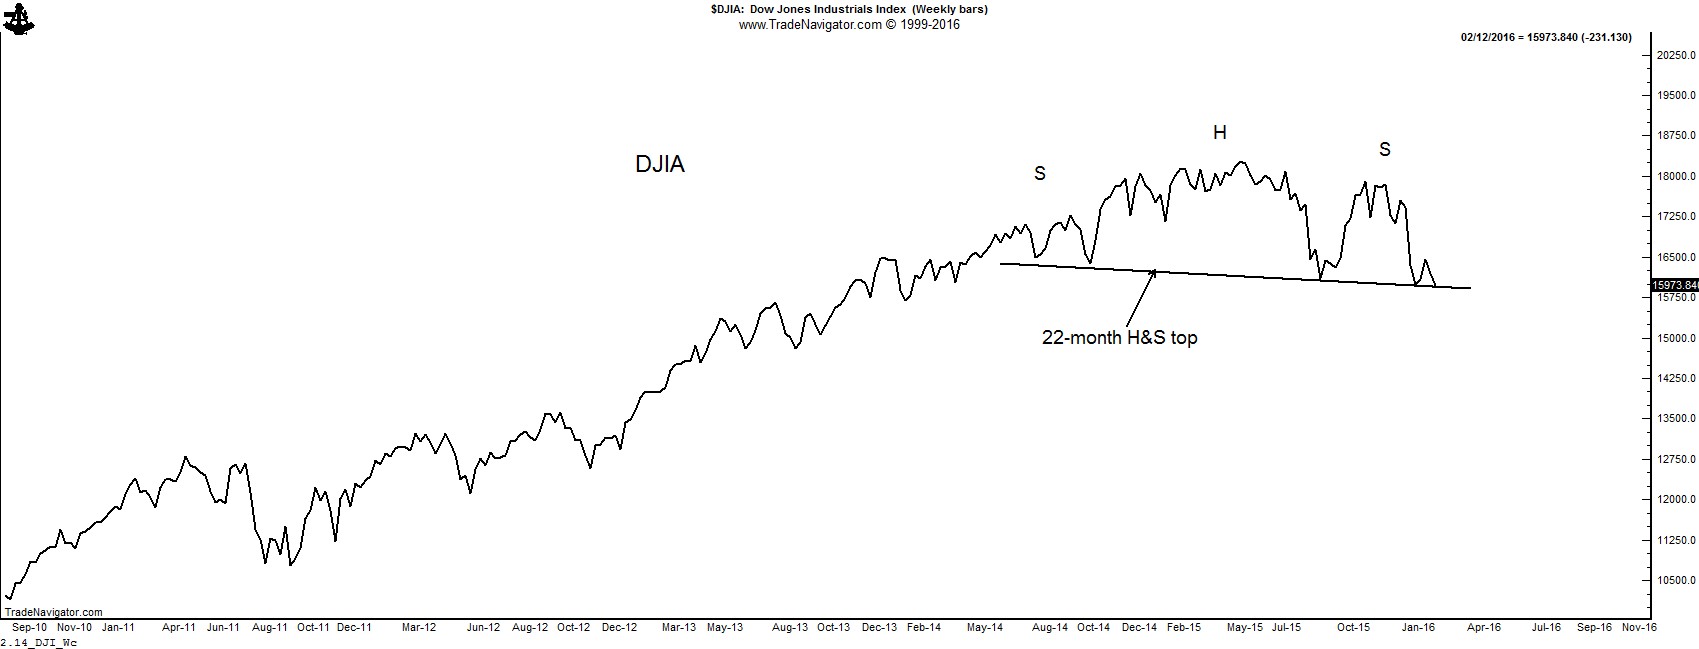
As the charts of the Dow Jones Composite, Dow Industrials and S&P 500 show below, the largest slug of volume has been in the right shoulder. This is NOT a sign of a valid H&S pattern, thus the interpretation of a H&S top in the U.S. stock index charts is not likely to be correct.
 Read More


 Read More