Tag Archive for: $USD/SEK

Factor Update, May 1st

This content is for members only

Factor Update – April 24th

This content is for members only

Factor Update – April 3rd

This content is for members only

Factor Alert – March 30th


Factor Alert – March 30th

There are a few charts of interest developing this week.
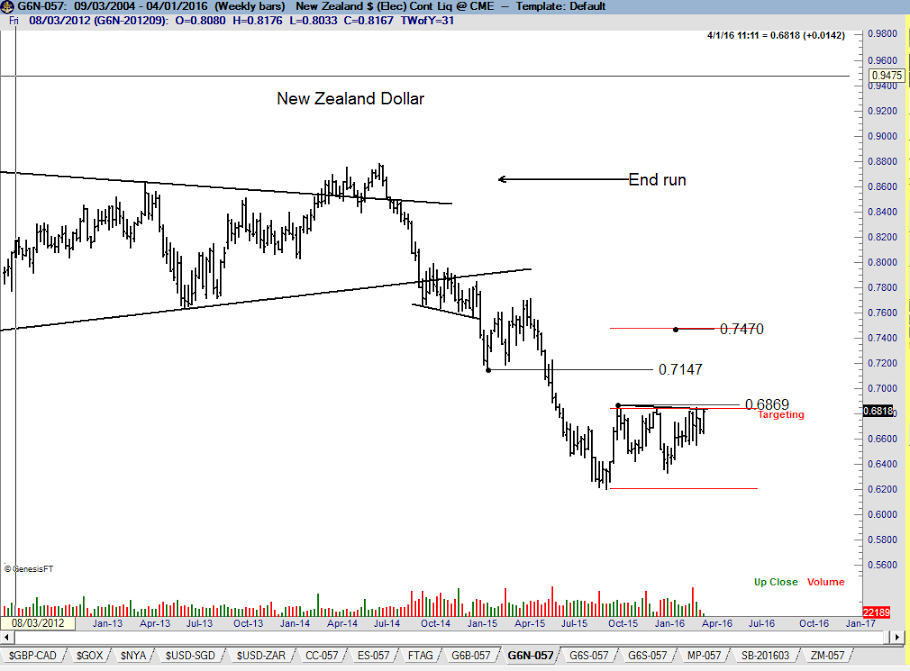
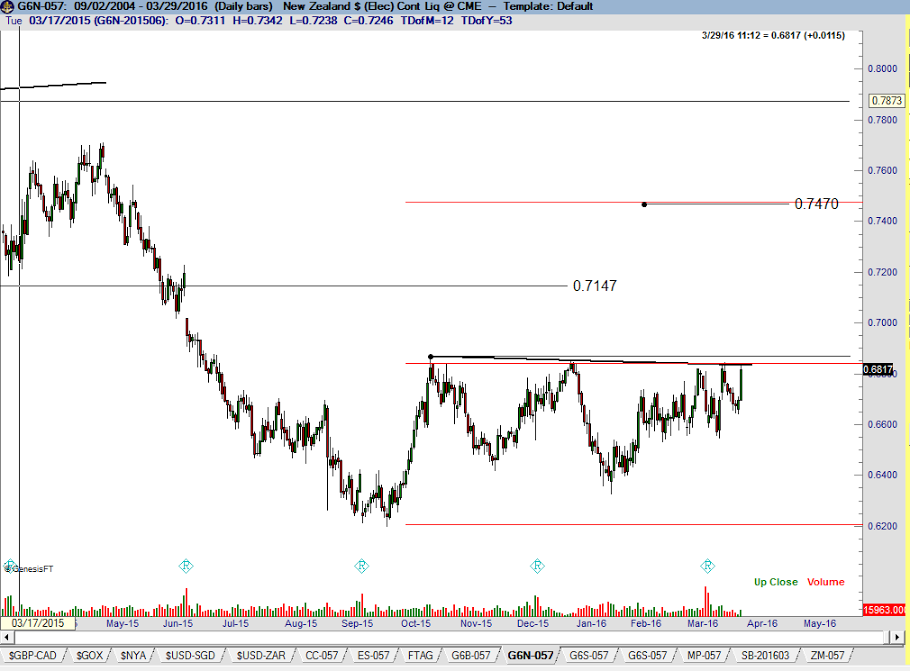
New Zealand Dollar. This chart appears to be completing a common bottom on the weekly and daily graphs. A decisive close above the Oct 2015 high would complete this base area and establish a target of .7470, although resistance should be expected at the Feb 2015 low of .7147. This is a possible Factor Move.

NOTE:  This is a sample report that members of Peter Brandt’s Factor Service receive on a weekly basis.  To consider membership, please visit this page for further details:  Factor Membership Option

1
2
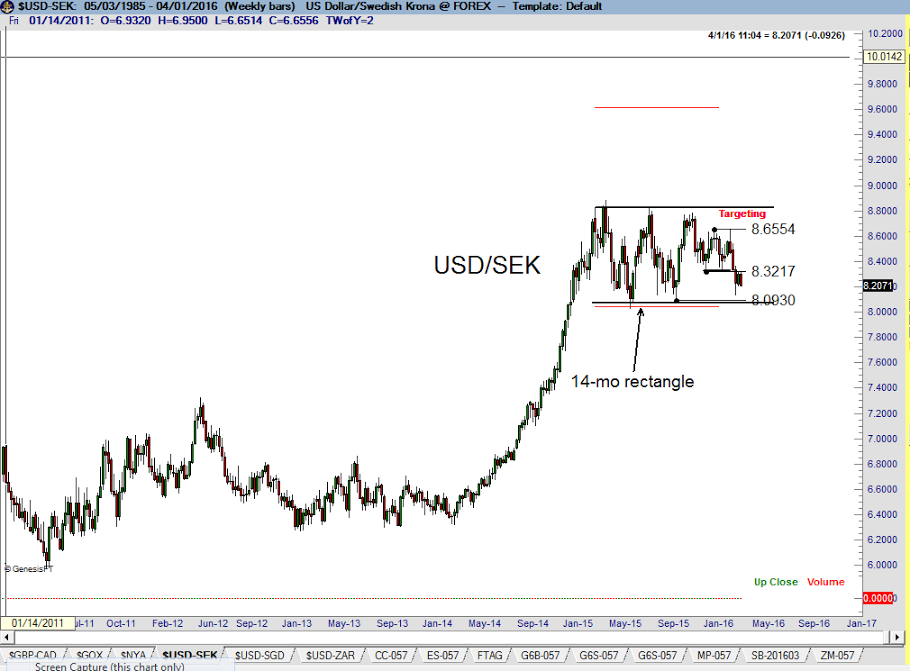
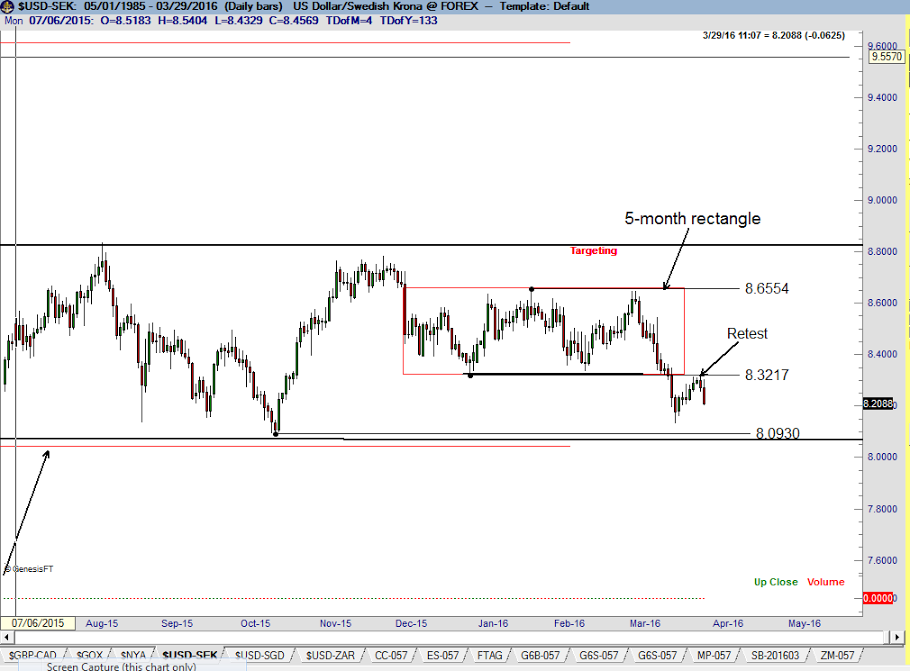
USD/SEK. The 14-month rectangle continues to develop on the weekly graph. I have not ruled out a downside breakout. Note that the rally in recent days retested the under belly of a 5-month rectangle on the daily graph (red box). This is the type of chart construction that offers me the opportunity to establish an anticipatory position, although there is always the danger of being whipsawed within a trading range.
3
4
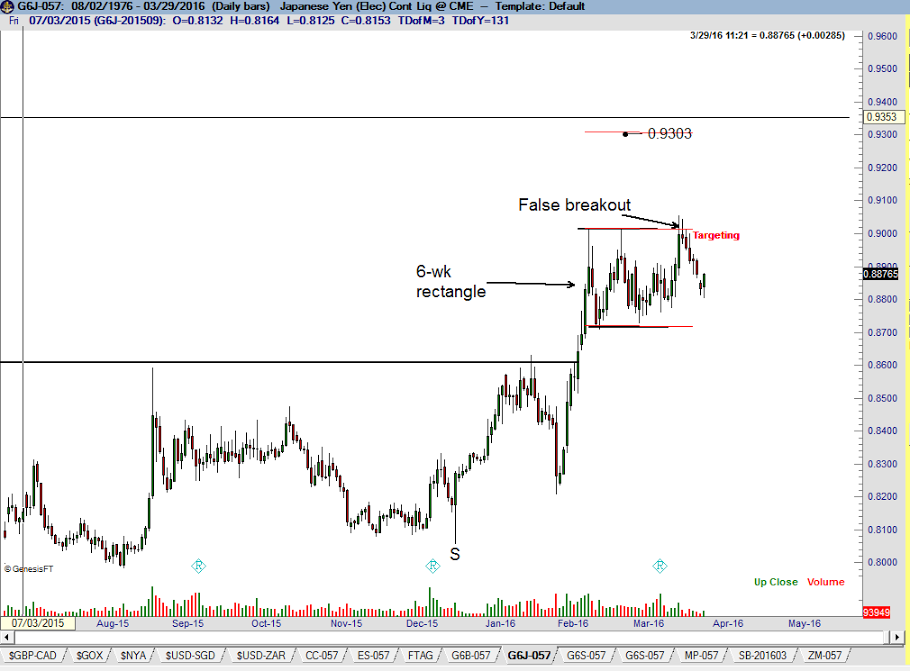
Japanese Yen. My bias in the Yen is well advertised. The bull trap of Mar 17 needs to be resolved. The question is whether the weak longs established with the false breakout of the 6-week rectangle on the daily graph have been adequately washed out. The long-term trend in Yen futures remains up.
5
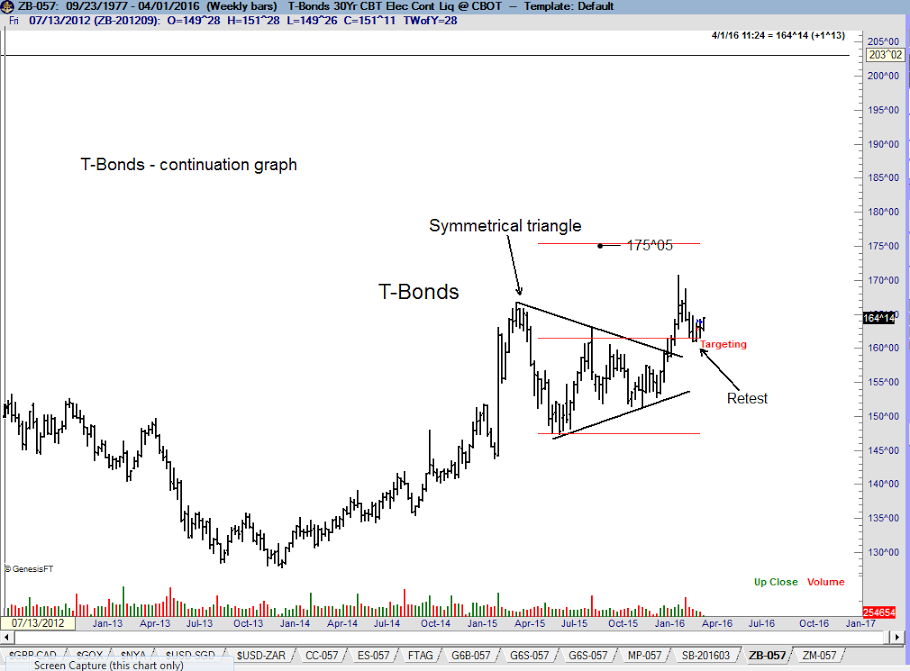
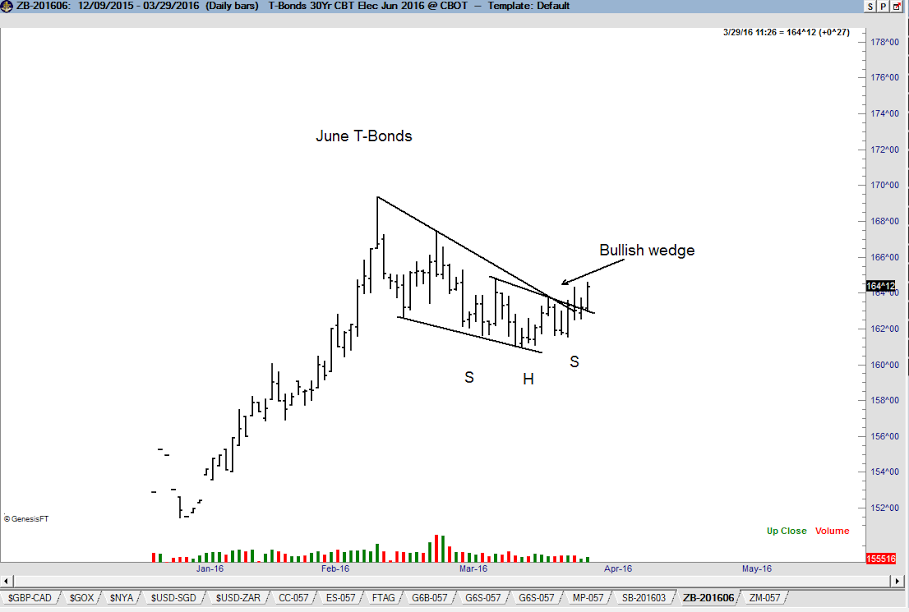
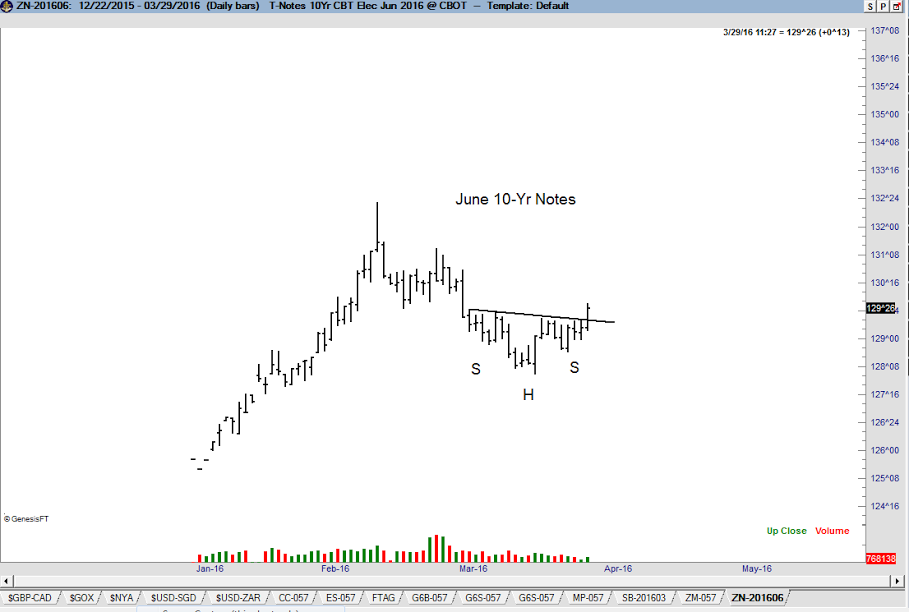
U.S. Treasuries. The weekly continuation chart in T-Bonds appears to be a completed symmetrical triangle whereby the recent decline was simply a retest. The daily graph of June Bonds has completed a bullish wedge as well as a small 4-week H&S bottom. This is a Factor Move pending a firm close this week. The daily chart of the 10-Yr. Notes has completed a well-defined, but small, H&S bottom.
6
7
8
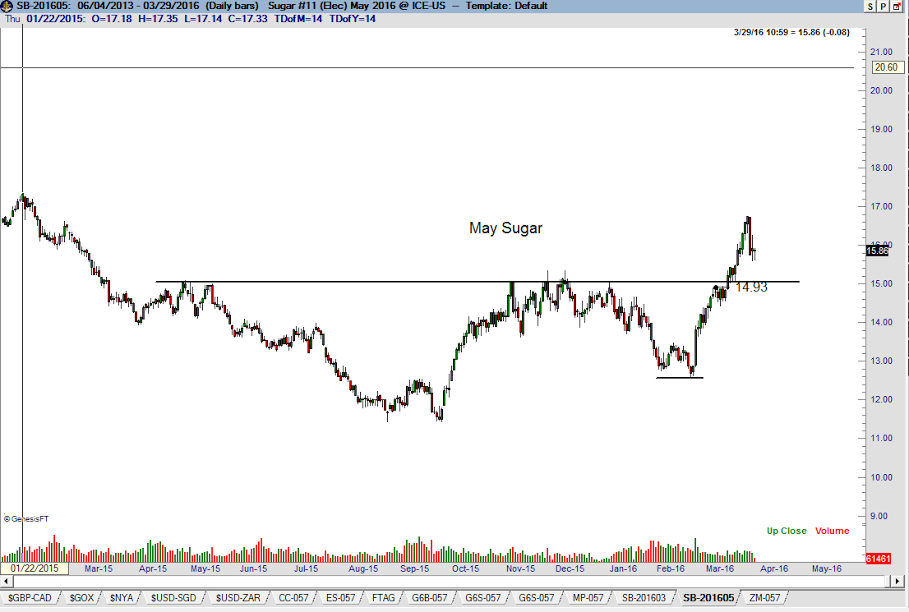
Sugar. The decline this week may become the retest of the underling base in May Sugar.
9
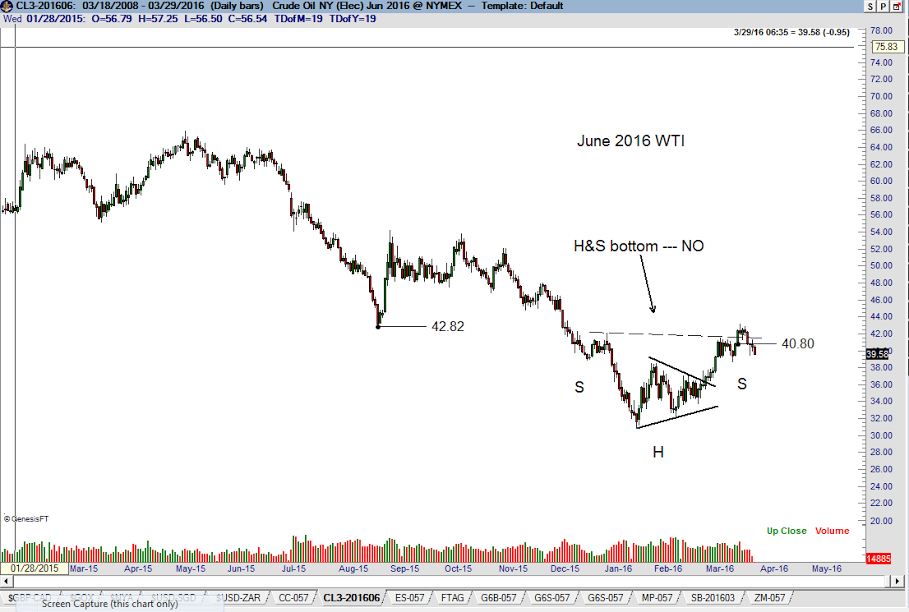
Crude Oil. I am not surprised by the decline today in Crude. It is difficult for me to be constructive on the charts, even though the weekly graph has completed a sizable falling wedge (not shown). I have no present interest in trade WTI.
10
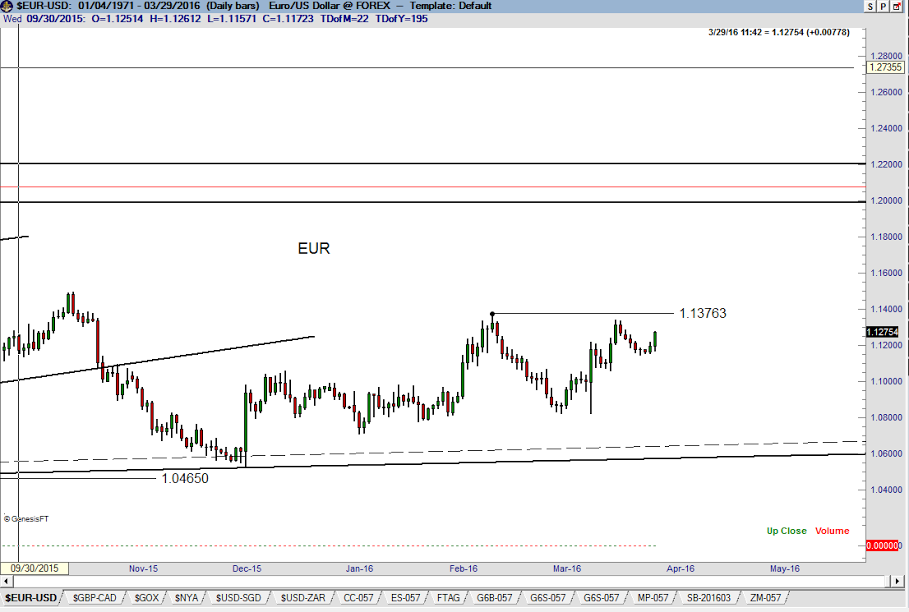
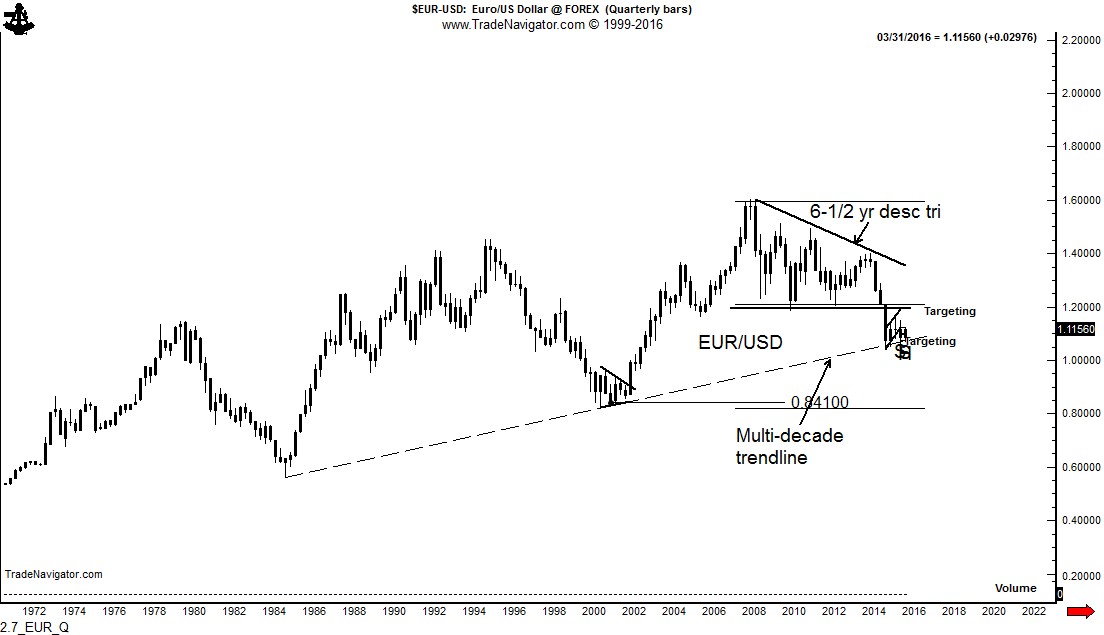
Eurocurrency. Long-time Factor members are well aware of the January Effect in the EUR/USD crossrate.  It is possible that the Jan 2016 low will qualify as the annual low. If so, EUR/USD could advance toward major resistance at 1.2000.
11
Just a word of warning is in order. The signals in Bonds, USDSEK, NZD and Sugar look quite promising. Yet, I continue to view the current markets as choppy. I remain committed to assuming under-leveraged positions in well-defined chart signals.

NOTE:  This is a sample report that members of Peter Brandt’s Factor Service receive on a weekly basis.  To consider membership, please visit this page for further details:  Factor Membership Option


plb
###

Factor Update, March 20, 2016


 General Market Commentary

Not all market environments are equal. Similarly, the same market environment can treat different trading styles in very different ways – some favorably, others miserably. The current markets, in my opinion, are neutral/hostile to classical charting principles. Current markets are volatile; false and premature breakouts have increased in 2016 to date; and, there is a lack of substantial patterns under construction. I have experienced this type of trading environment before – many times. There are profits to be had in some markets, but there are also an oversupply of land mines. For me, this type of trading environment has not correlated well with a robust three-month forward ROR. Of course I will continue to take signals that are promising knowing that sooner or later markets favorable to classical charting will return. Warning: I generally ignore one-day price action, preferring area patterns. Yet, nearly every market discussed in this Update experienced a narrow real-range bar on Friday that occurred at or just below the close of Thursday’s wide range day. This development suggests the possibility of a shake out next week. According, I enter next week in a very defensive frame of mind.

Market Review

Read More

Factor Update, March 20, 2016


General Market Commentary

  Not all market environments are equal. Similarly, the same market environment can treat different trading styles in very different ways – some favorably, others miserably. The current markets, in my opinion, are neutral/hostile to classical charting principles. Current markets are volatile; false and premature breakouts have increased in 2016 to date; and, there is a lack of substantial patterns under construction. I have experienced this type of trading environment before – many times. There are profits to be had in some markets, but there are also an oversupply of land mines. For me, this type of trading environment has not correlated well with a robust three-month forward ROR. Of course I will continue to take signals that are promising knowing that sooner or later markets favorable to classical charting will return. Warning: I generally ignore one-day price action, preferring area patterns. Yet, nearly every market discussed in this Update experienced a narrow real-range bar on Friday that occurred at or just below the close of Thursday’s wide range day. This development suggests the possibility of a shake out next week. According, I enter next week in a very defensive frame of mind.

Market Review

Read More

Short England Long Sweden — that is what the forex markets are saying


British Pound/Swedish Krona price charts displays extremely bearish construction

The weekly chart of $GBP/SEK completed an 11-month H&S top in mid January. This pattern has a price target of 11.18 SEK to 1 GBP. 2.23_GBP.SEK_W Read More

Japanese Yen is attempting to break out of a major H&S pattern.

A chart analysis of the forex markets

This post looks at the present forex markets through the lens of classical charting principles, as originally forumated in the early 1930s by Richard W. Schabacker, editor at the time of Fortune Magazine. Factor LLC is recognized as one of the world’s preeminent authorities on classical charting principles as applied to the futures and forex markets.

There are a number of forex crosses that indicate substantial trading opportunities for traders willing to hold positions for weeks or even months. Before examining the current forex markets, a basic understanding of classical charting principles is approriate.
  • Charts simply show where a market has been, what it is doing now, and what the path of least resistance might be. Classical charting is simply an attempt to define market behavior in geometric terms. The real edge provided by classical charting comes from the marriage of risk management with well-defined geometric patterns.
  • There is no magic in price charting. Charts do NOT predict the future. Unlike some Elliott Wave adherents who attempt to label every zig and zag, I believe that the vast overwhelming majority of markets the vast overwhelming proportion of time cannot be understood through the lenses of classical chart principles (or any other method of technical analysis, including Elliott Wave Theory).
  • Well-defined chart patterns naturally provide opposite possible outcomes. A rectangle can complete in either direction. A rising wedge can become a running wedge. A symmetrical triangle can fake a trader out in more ways than imaginable. A H&S pattern can become a H&S failure. And on and on it goes.
  • Charts are subject to morphology. I do my best to always find a geometric explanation for price action. As a chart morphs it can be subject to different geometric construction. As a general rule, intraday charts morph more often than daily charts, daily charts morph more often than weekly charts. But, more often than not a market cannot be explained easily by geometry. It is then time to find another market. This is why I might be focused on Robusta Coffee one day and some foreign stock index another day. I want to focus on markets I can define geometrically.
  • Reliable chart trading is cyclical. There are periods during the year (an average of two periods lasting two or so months each) when an unusual number of markets form well defined patterns AND the markets respond to those patterns in predictable fashion. Using language of farming, this is time to make hay. During the other periods we rely on aggressive risk management to limit our losses and keep out pile of chips somewhat intact.
  • It is a thing of beauty when classical chart configurations work. It is a thing of frustration when they do not work. It is a thing of confusion when the majority of markets defy definition from a classical charting perspective.

A review of selective forex markets

Eurocurrency (EUR/USD) The long-term trend (as featured by the 45-year trendline) in EUR is under threat, as shown by the quarterly graph. The dominant chart construction is the 6-1/2 year descending triangle completed in Jan 2015. This pattern has a target of $.84. Such a decline would likely be accompanied by a massive change in the European Currency Mechanism (ERM). 2.7_EUR_Q Read More