

Factor Update, March 20, 2016
General Market Commentary
Not all market environments are equal. Similarly, the same market environment can treat different trading styles in very different ways – some favorably, others miserably. The current markets, in my opinion, are neutral/hostile to classical charting principles. Current markets are volatile; false and premature breakouts have increased in 2016 to date; and, there is a lack of substantial patterns under construction. I have experienced this type of trading environment before – many times. There are profits to be had in some markets, but there are also an oversupply of land mines. For me, this type of trading environment has not correlated well with a robust three-month forward ROR. Of course I will continue to take signals that are promising knowing that sooner or later markets favorable to classical charting will return.
Warning: I generally ignore one-day price action, preferring area patterns. Yet, nearly every market discussed in this Update experienced a narrow real-range bar on Friday that occurred at or just below the close of Thursday’s wide range day. This development suggests the possibility of a shake out next week. According, I enter next week in a very defensive frame of mind.
Market Review
![]()
NOTE: This is a sample report that members of Peter Brandt’s Factor Service receive on a weekly basis. To consider membership, please visit this page for further details: Factor Membership Option
Factor Moves are currently ongoing in:
- Gold
- Crude Oil
- Japanese Yen
- AUD/NZD
- USD/NOK
- Silver
A Factor Move was completed or terminated in Copper. A Factor Move is developing in USD/SEK. This issue of the Factor also comments on the grain markets, food/fiber/softs (including SGG, the Sugar ETN), Heating Oil, Mexican
Peso, Canadian Dollars, AVGO and U.S. stock indexes.
Factor Moves in Progress
Crude Oil (weekly and daily charts)
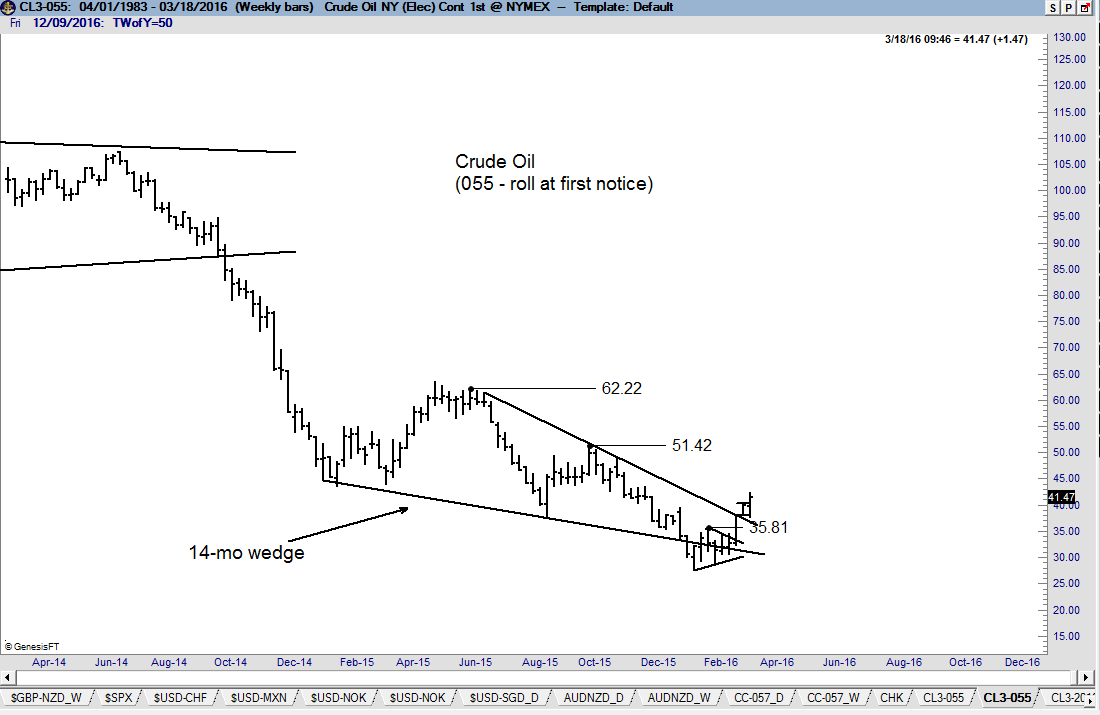
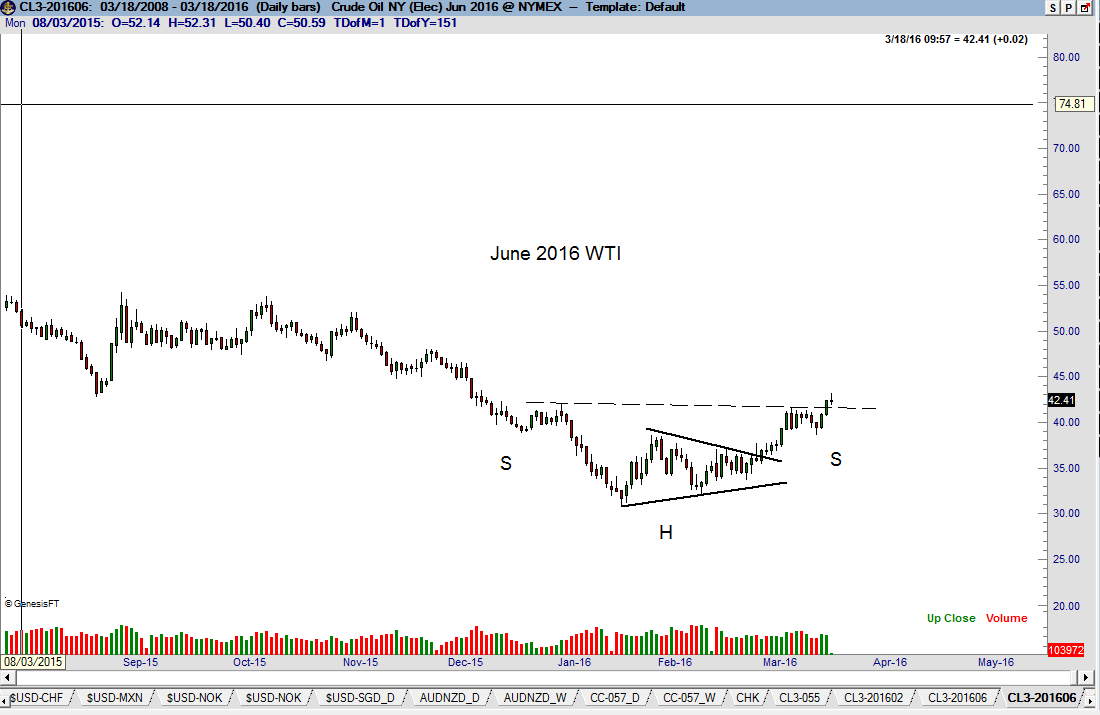
The advance in WTI on Mar 7 completed a 14-month falling wedge pattern on the weekly chart. This pattern has a minimum target of 51.00 assuming that the chart does not undergo morphing (this is always a big assumption). The daily chart of the June 2016 contract shows a 6-week symmetrical triangle bottom. Also note the possibility of a 14-week H&S bottom pattern (dashed neckline). I personally do not like the H&S bottom labeling because I prefer that shoulders overlap with the head. The shoulders in this case have no overlap with the head. [Note: A falling wedge is a diagonal pattern. I rate diagonal patterns as far inferior to horizontal patterns.] Note: Friday was a minor reversal day on a short term basis. Factor is flat.
Gold (weekly and daily charts)
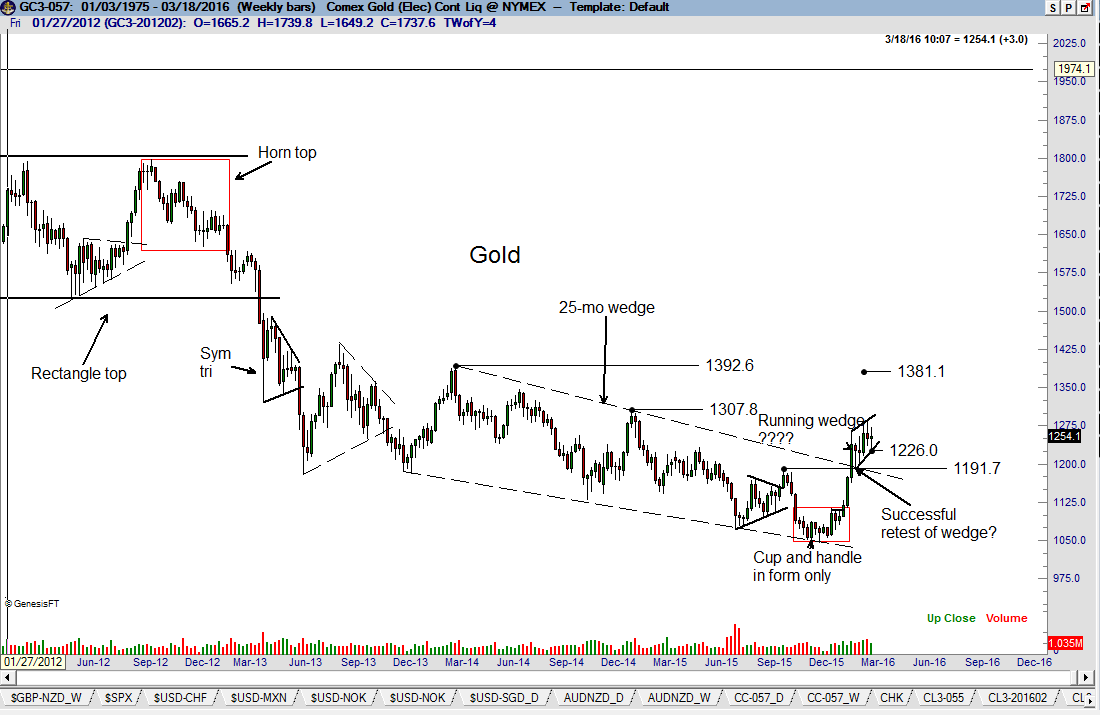
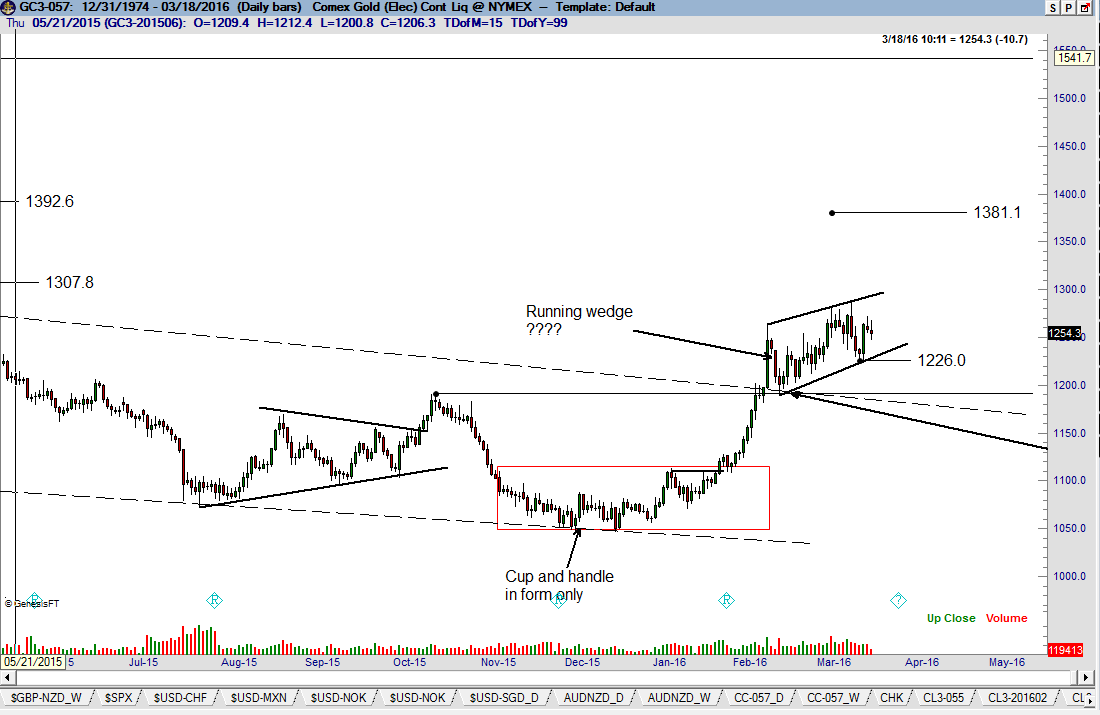
The dominant chart construction in Gold is the completed 25-month wedge on the weekly graph. This pattern has implied targets of 1307 and 1392. The daily graph seems to indicate that momentum has stalled. The close on Friday was $8 higher than the close of the Feb 11 breakout day – five weeks ago. I have continually pointed out that falling wedges in raw material markets typically result in considerable backing and filling – even to the extent of retesting the low of the previous bear market. As the daily chart is set up right now, the only chance for an accelerated rally would be the completion of a running wedge, as noted. Factor is flat.
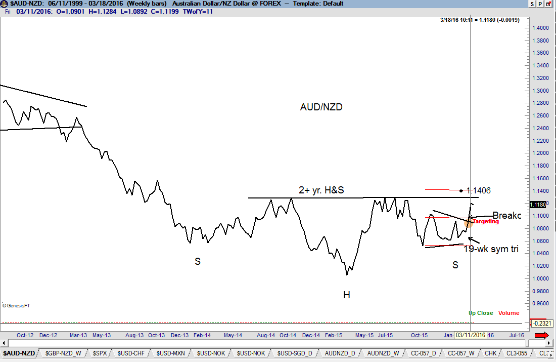
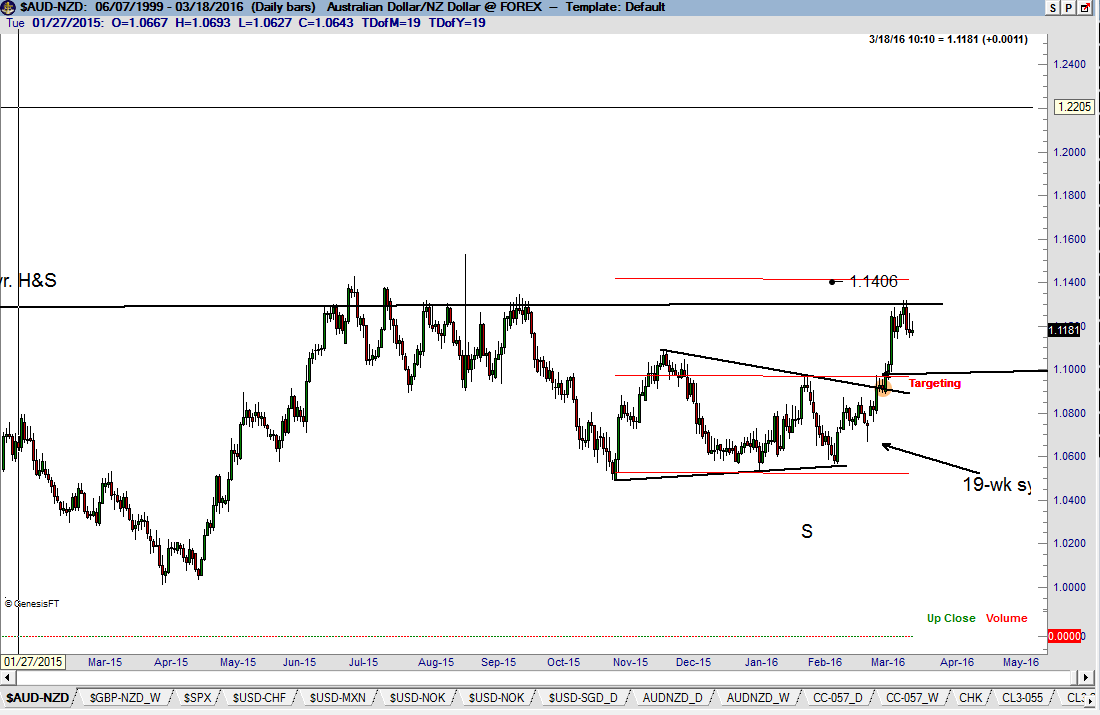
AUD/NZD (weekly and daily charts)
See the Factor Update dated March 13, 2016 for an anatomy of this Forex trade. The dominant chart construction is the POSSIBLE 2+ year H&S bottom pattern on the weekly graph (right). The Factor correctly identified the symmetrical triangle on the daily graph serving as the right shoulder of the H&S pattern, and established a long position accordingly. While this triangle has targets in the 1.14xx area, I felt that the area of the Jun-Sep 2015 highs represented stiff resistance – so I have liquidated two-thirds of my initial long position.
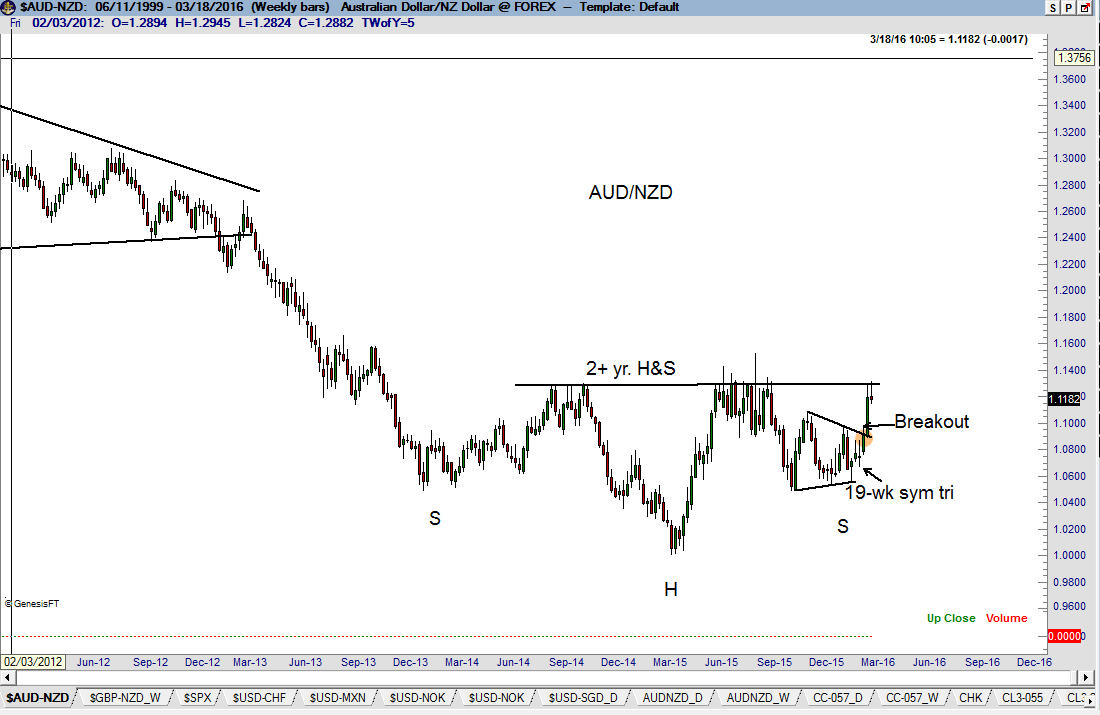
I am monitoring the weekly graph for the completion of the H&S bottom. See the first chart below on the daily graph showing this H&S based on a weekly closing price chart. Factor remains long one layer.
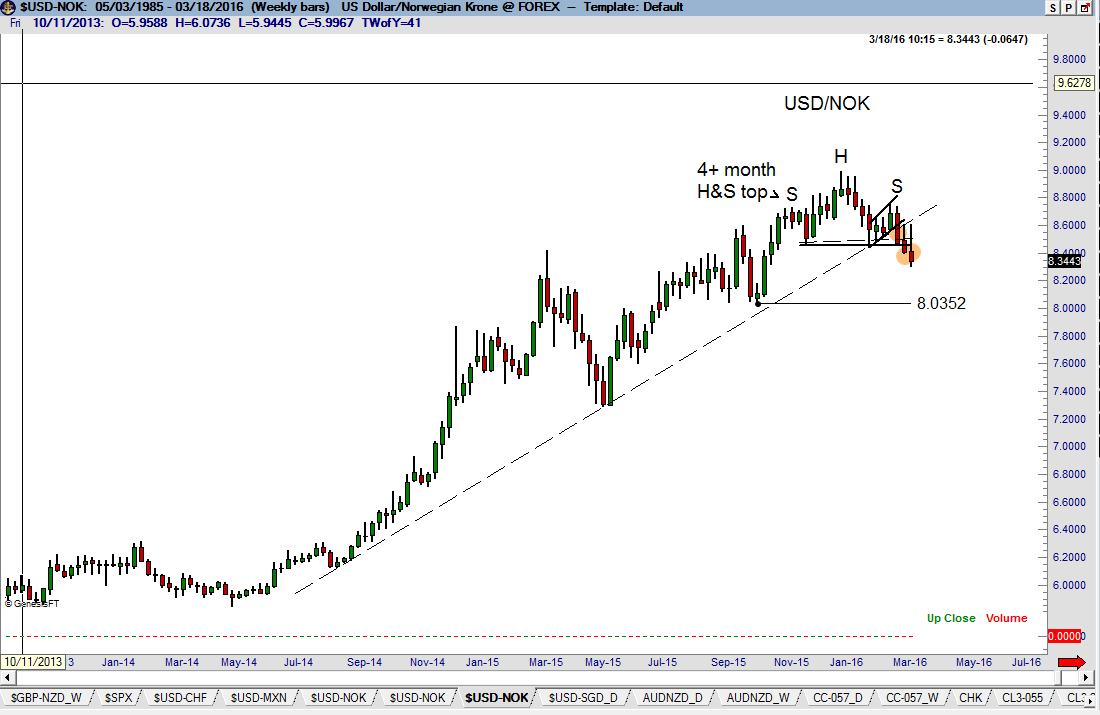
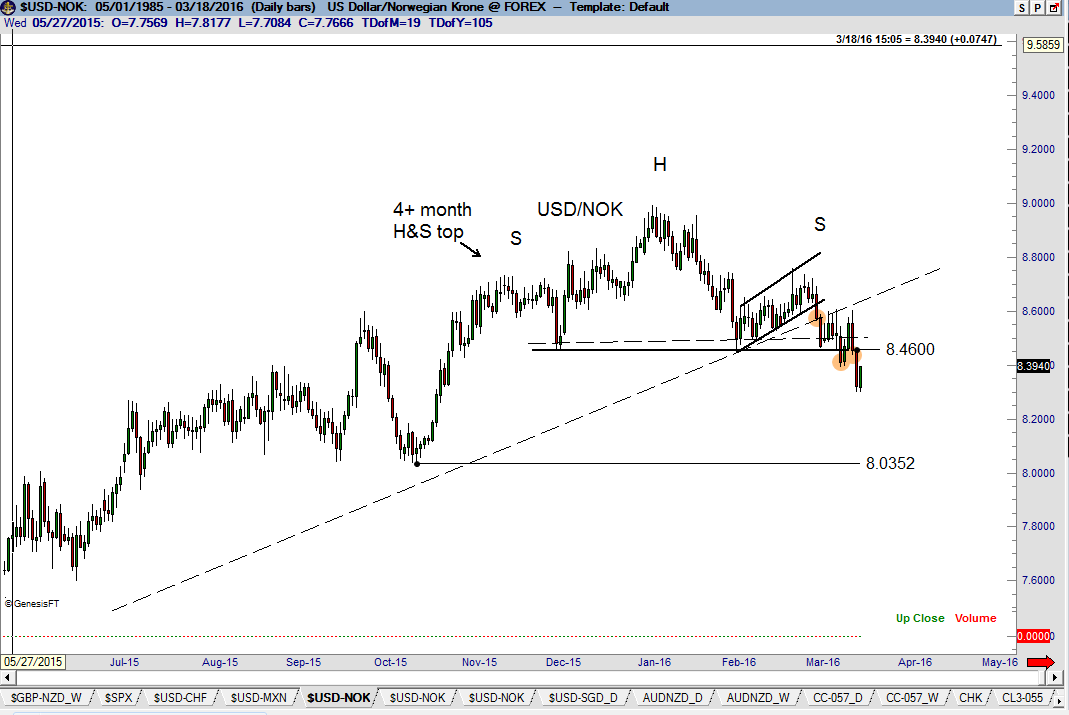
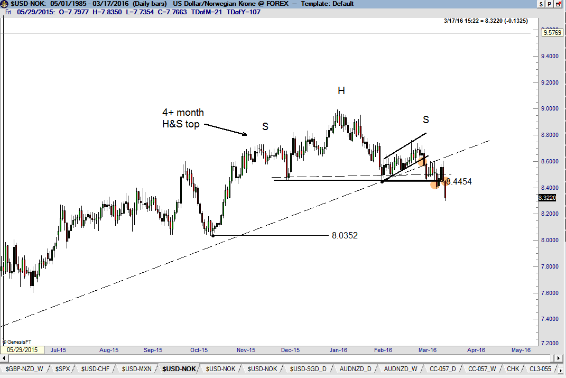
USD/NOK (weekly and daily charts)
See the Anatomy of a Trade featuring USD/NOK on pages 19-20. The dominant chart construction in this forex pair is the H&S top completed by the WBB decline on Mar 17. Factor is short. My give-up point on this trade is 8.5051. If stopped out I will have lost 55 BPs on my excursions into this cross rate.
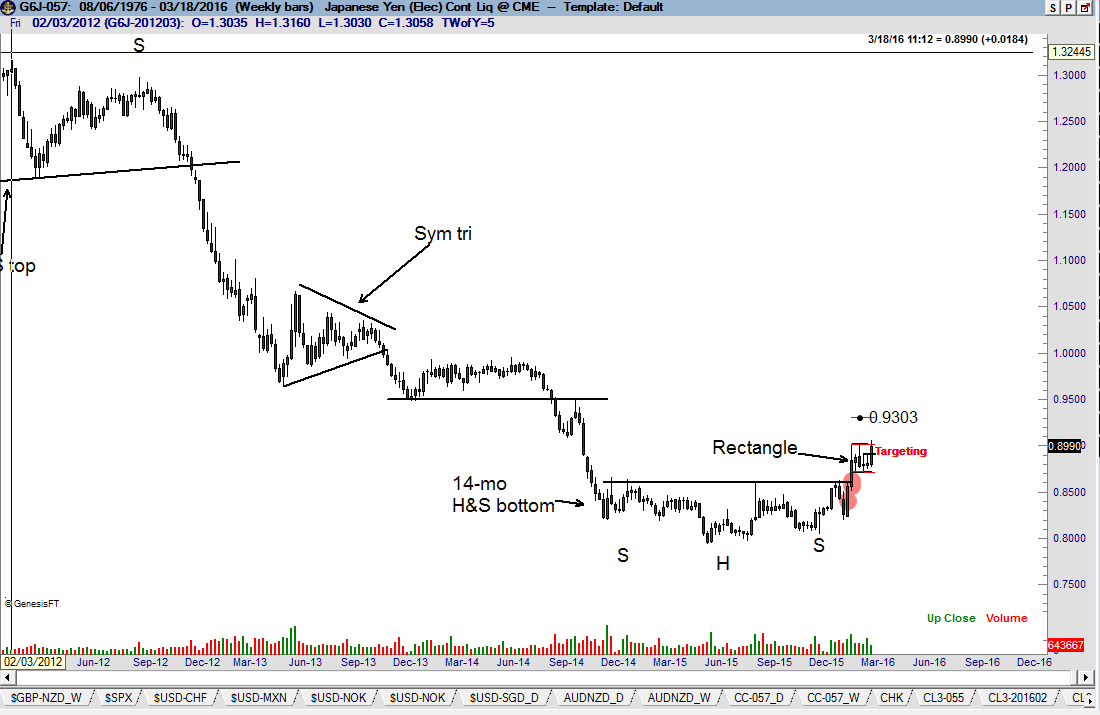
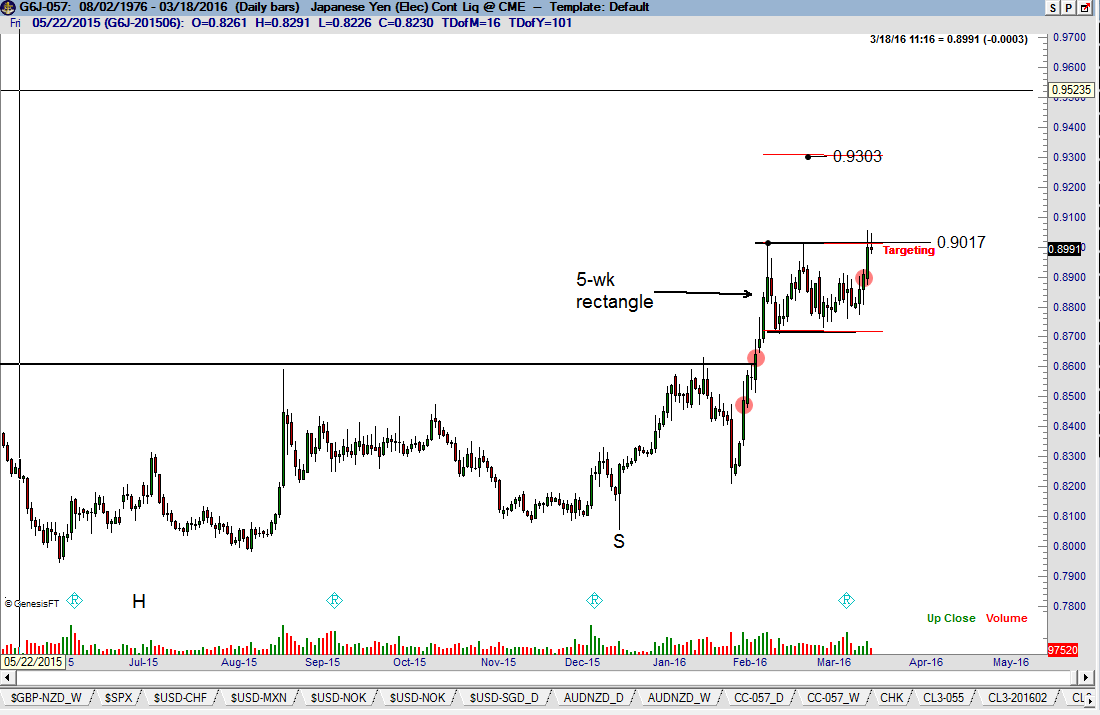
Japanese Yen futures (weekly and daily charts)
The dominant chart construction in the Yen continues to be the completed H&S bottom on the weekly and daily graphs. While this pattern is subject to failure, it should be emphasized that well-defined chart configurations in the
Yen must always be taken seriously. Historically, the Yen is an outstanding charting market. The daily chart is attempting to complete a 5-week continuation rectangle. It is important for the Yen to close decisively above 9000 to
maintain upward momentum. Note: Friday was a minor reversal day on a short-term basis. That prices on Friday faltered at the upper boundary of the rectangle might be a sign this rectangle will morph. Factor is long a three-layer position in the Yen. I am not giving the last layer much room to move against me.
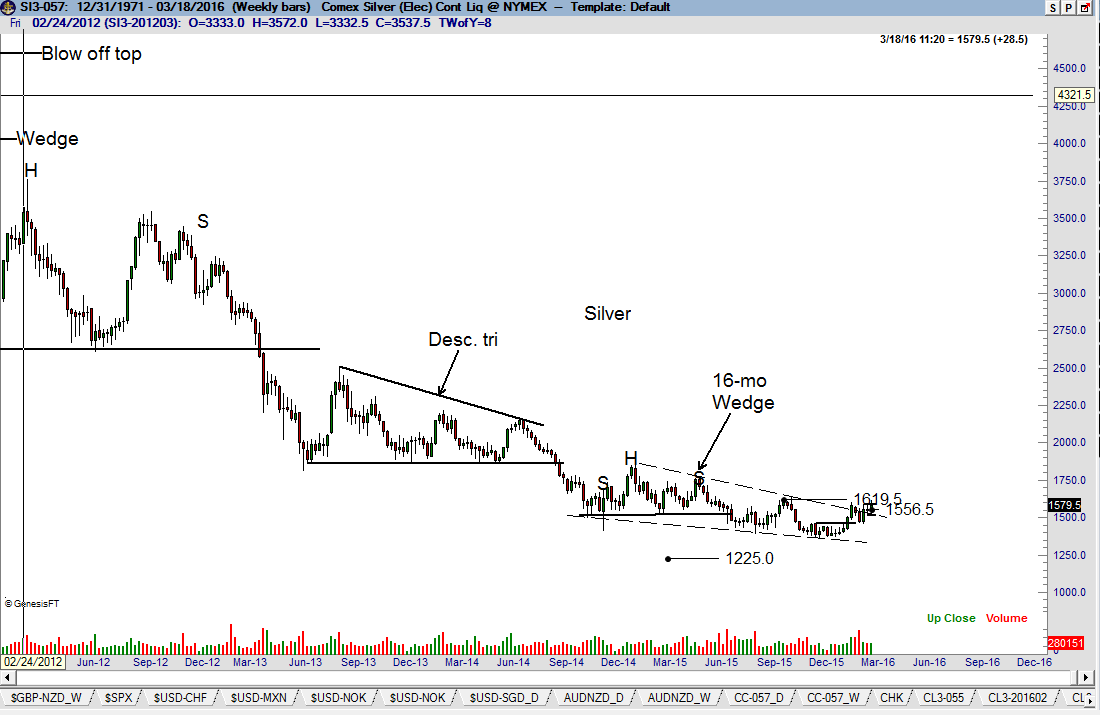
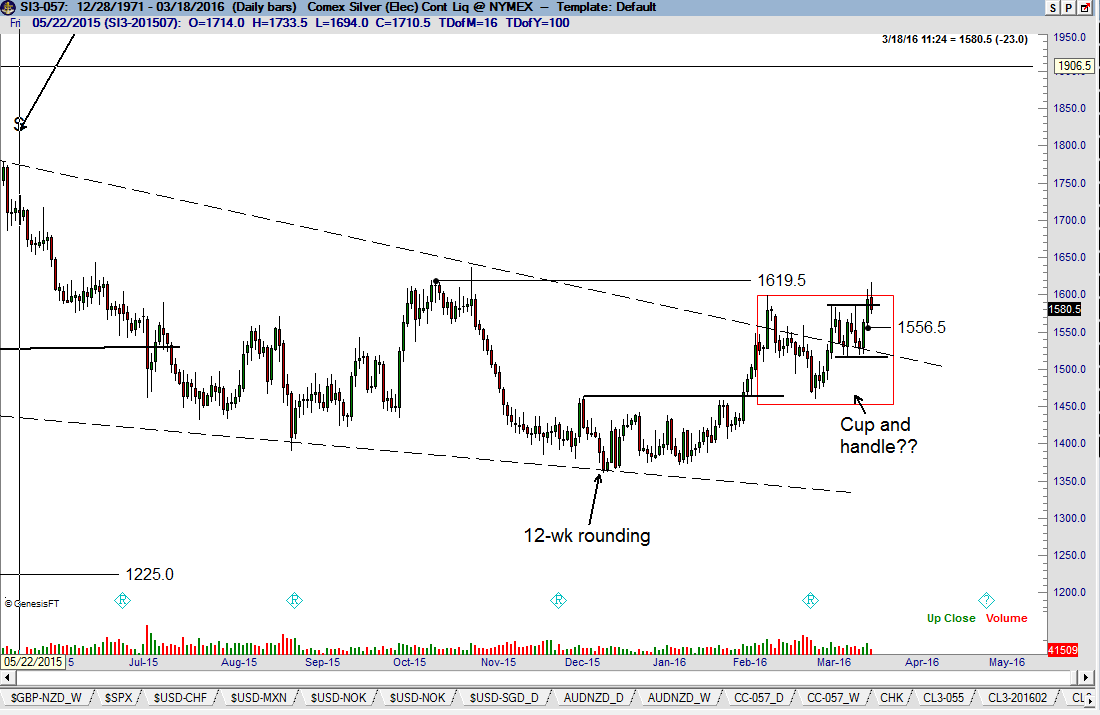
Silver (weekly and daily charts)
See the Factor Alert issued on Mar 17. The dominant chart construction in Silver is the 16-month wedge on the weekly graph. This pattern was arguably completed this past week. Two configurations are worthy of note on the daily graph. First, note that the bottom in Silver took the form of a 12-week rounding pattern. This pattern formed near the lower boundary of the wedge on the weekly chart. Second, the advance on Thursday arguably completed a 5-week cup and handle pattern. A close above the Oct 15 high at 1619 is required before the bottom in Silver is confirmed. Note: Friday was a minor reversal day on a short-term basis. Quite frankly, the advance in Silver has NOT been impressive. A close below 1556 would indicate that morphing will occur.
Other Markets
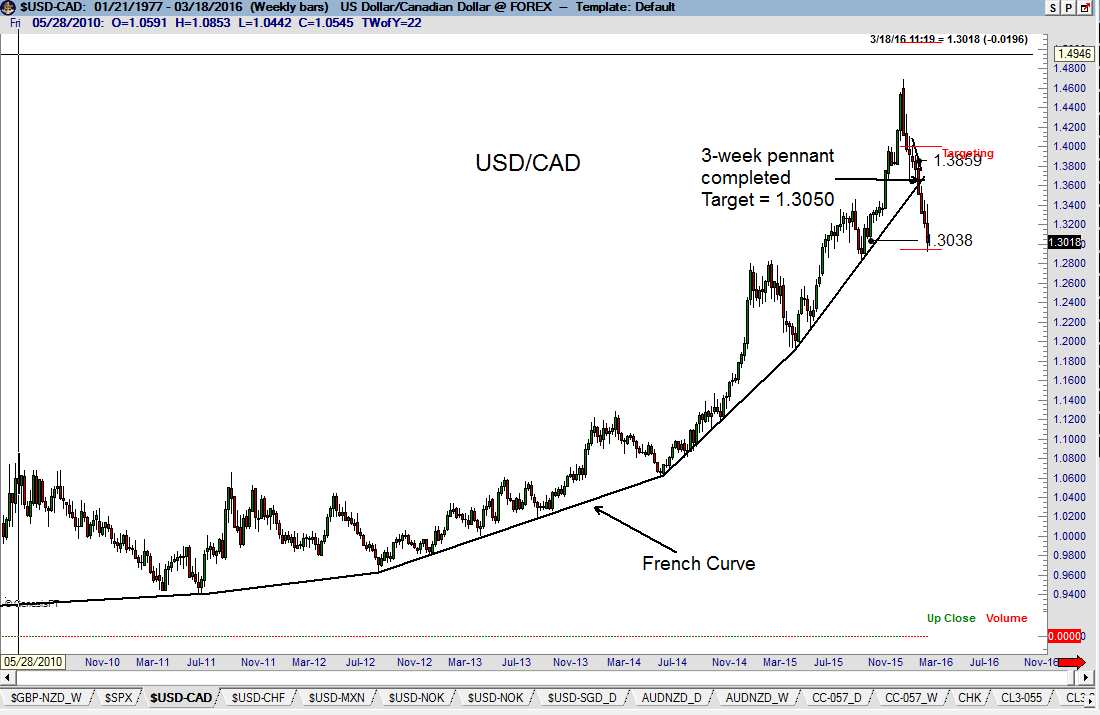
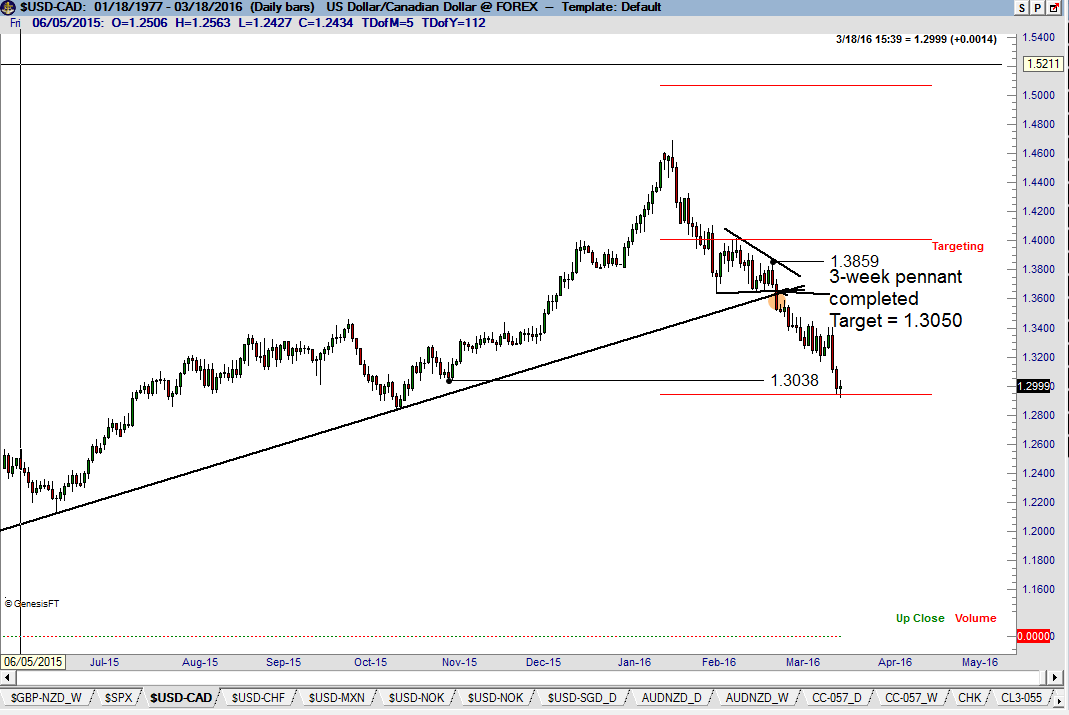
Canadian Dollar futures (daily and weekly USD/CAD spot charts)
I have featured this market for the past four weeks. Specifically, a significant sell signal came from the simultaneous violation on Feb 25 of an 8+ year French Curve on the weekly graph and the completion of a 3-week pennant on the daily chart. The target of 1.3050 was reached on Thursday. There could be further downside in the weeks and months ahead, but I am now flat. For me, this trade was the perfect storm. I am willing to risk up to 200 BPs on trades such as this when the completion of a small pattern (e.g., pennant) simultaneously accomplishes much more (e.g., French Curve). These types of special set ups only come around a couple times each year. They are usually trades that last only one to three weeks. Note: Friday was a minor reversal day on a short-term basis.
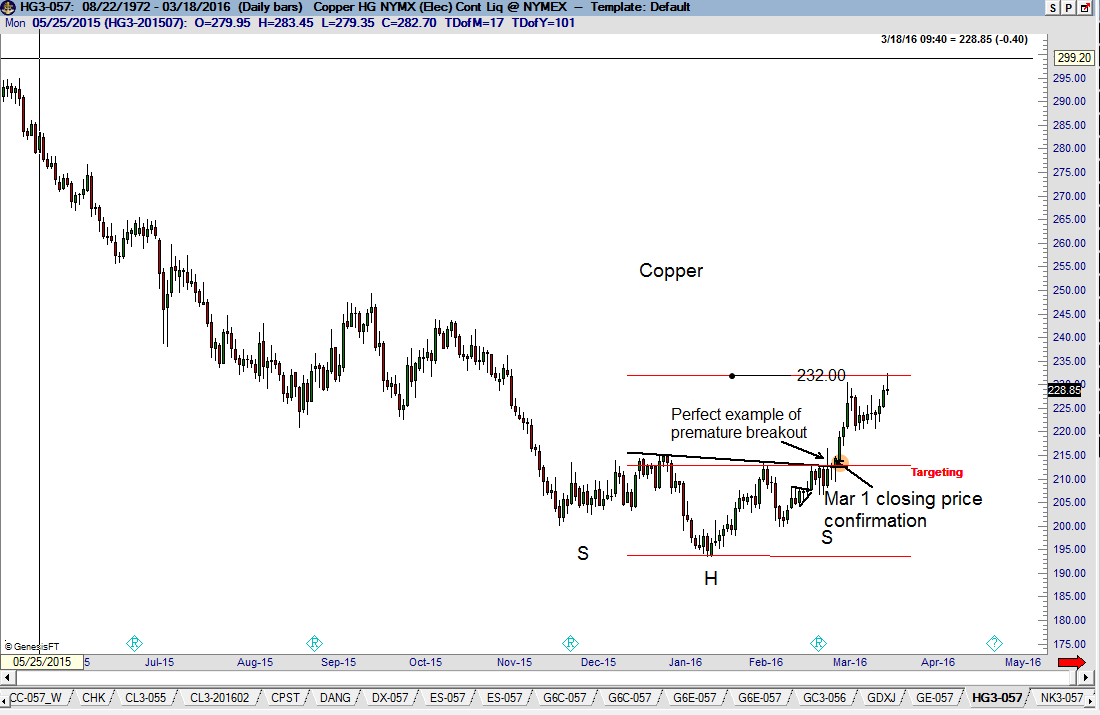
Copper (daily chart)
The rally on Friday reached the minimum target of 2.32 established by the Mar 1 completion of a 15-month H&S bottom. I am expecting Copper to trend higher over time. I will be monitoring Copper for a continuation pattern. Note: Friday was a minor reversal day on a short-term basis.
Food, fiber, softs (various charts)
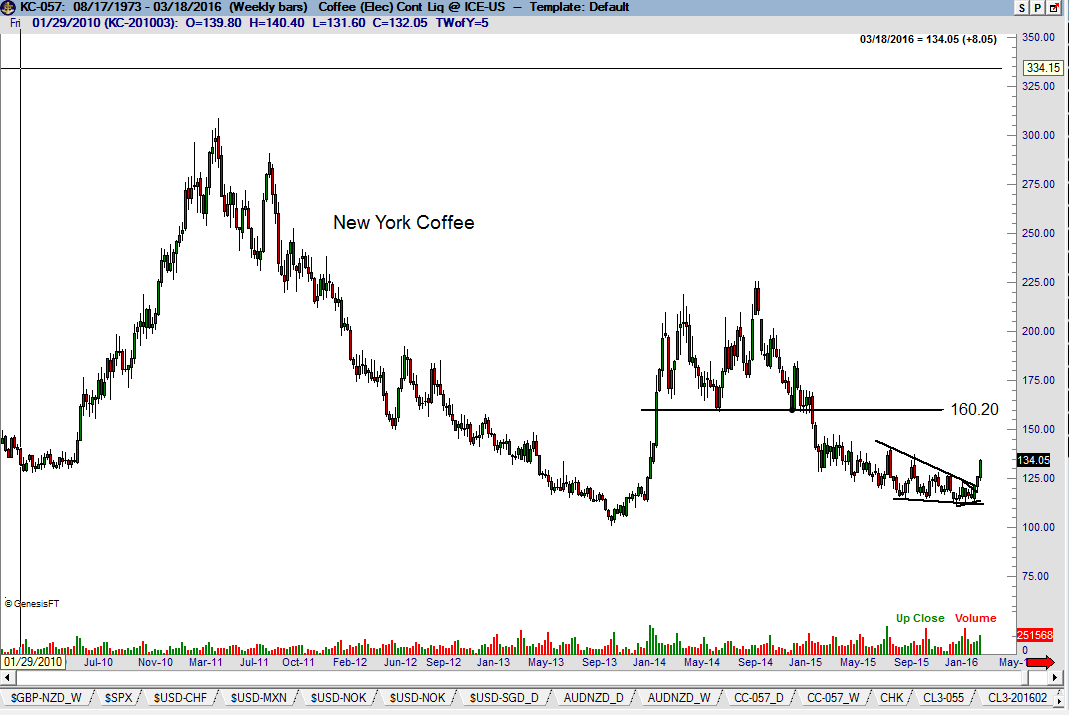
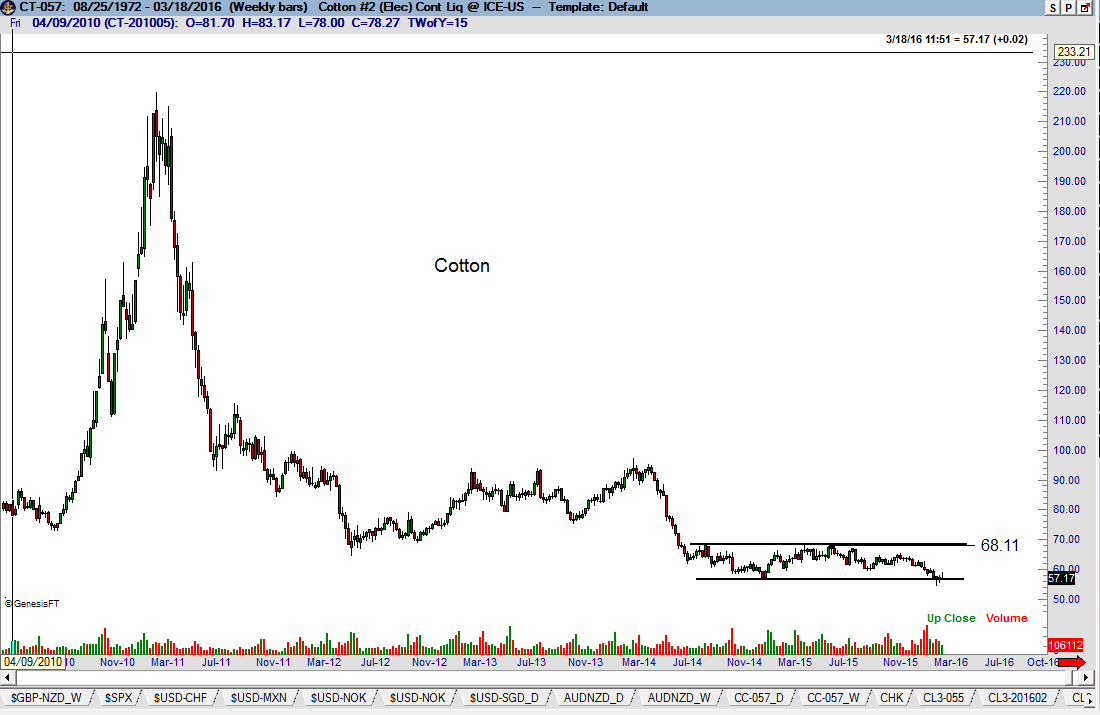
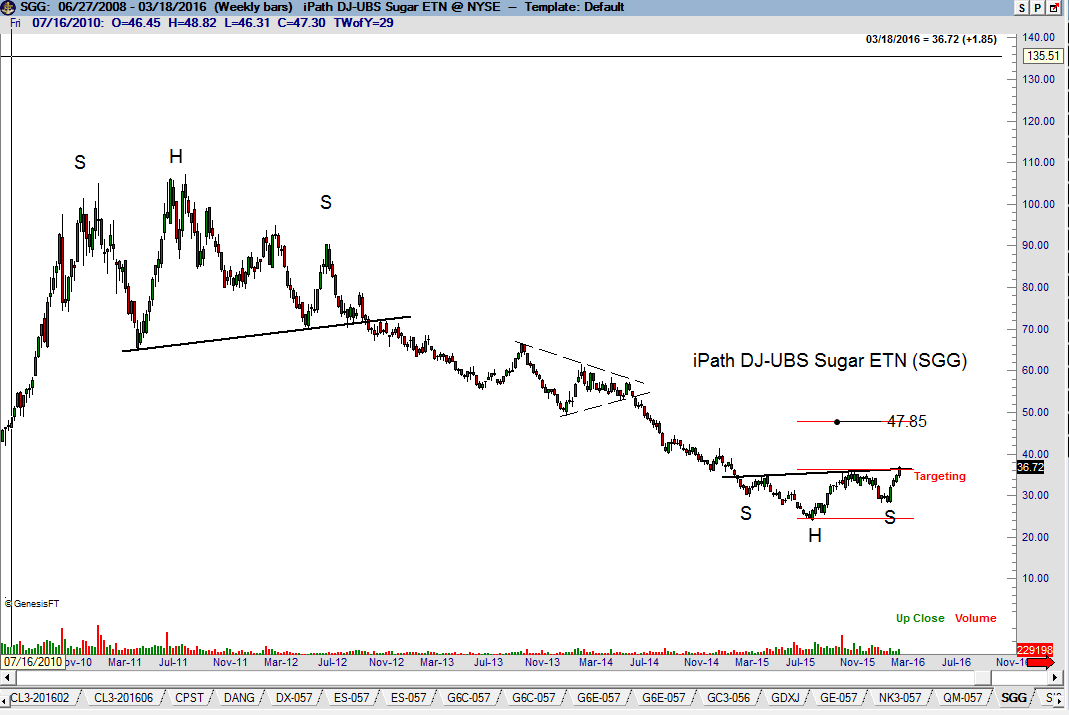
After several years of price declines, some members of food/fiber/softs have come alive in recent weeks. The recent advance in Coffee completed a falling wedge pattern. Note the strong line of resistance at 160. Cotton prices remain very depressed, but could be a candidate for a turn around. Cotton tends to experience boom-to-bust-to-boom cycles. Remember, low prices alone are not enough reason to establish a long position. Sugar is a most interesting market. SGG (the Sugar ETN) has completed a 12+ month H&S bottom with a gimpy left shoulder and belabored
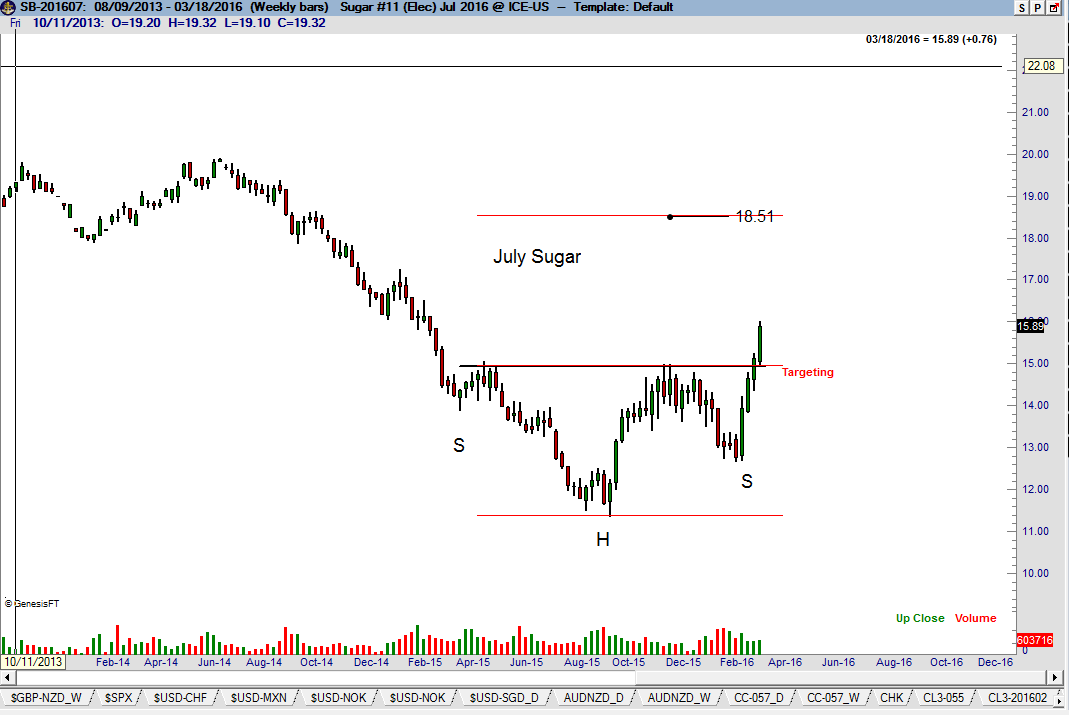
right shoulder. This pattern has a target of 47.85. A similar pattern exits in the contract for Jul Sugar futures with a target of 18.48.
Grain Markets
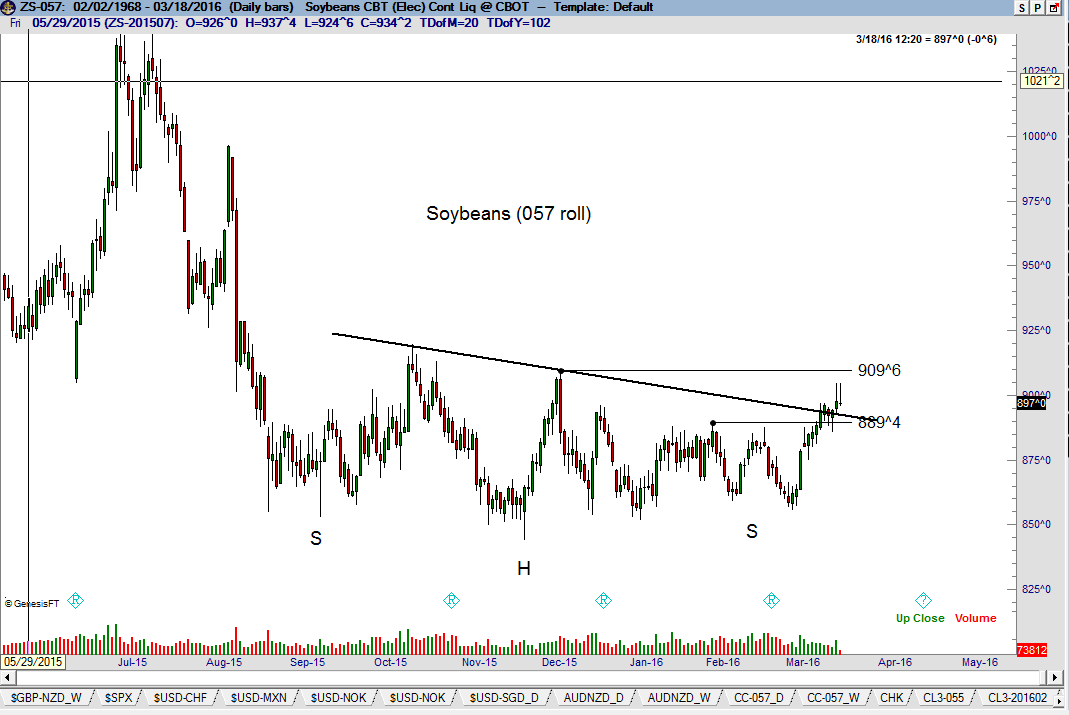
There are a few grain charts worthy of mention. The daily continuation graph of Soybeans (most active contract
month) displays a possible 7-month H&S bottom. There are a couple of problems with this analysis. First, a similar pattern does not appear in any of the individual contract months. I prefer that both the continuation chart and
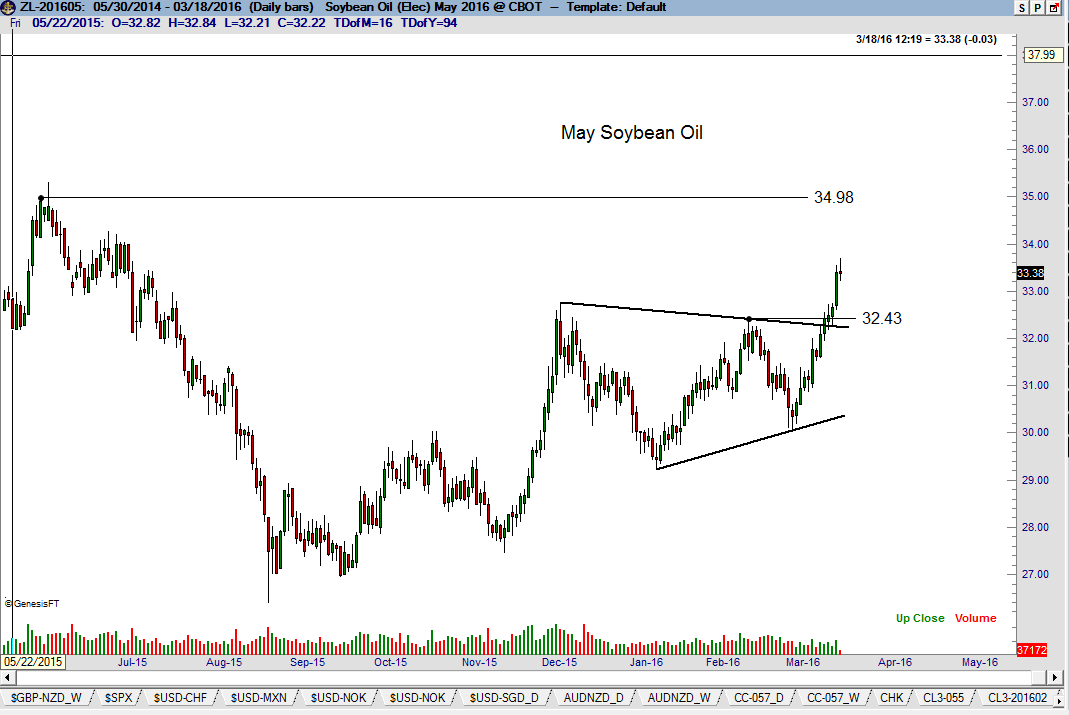
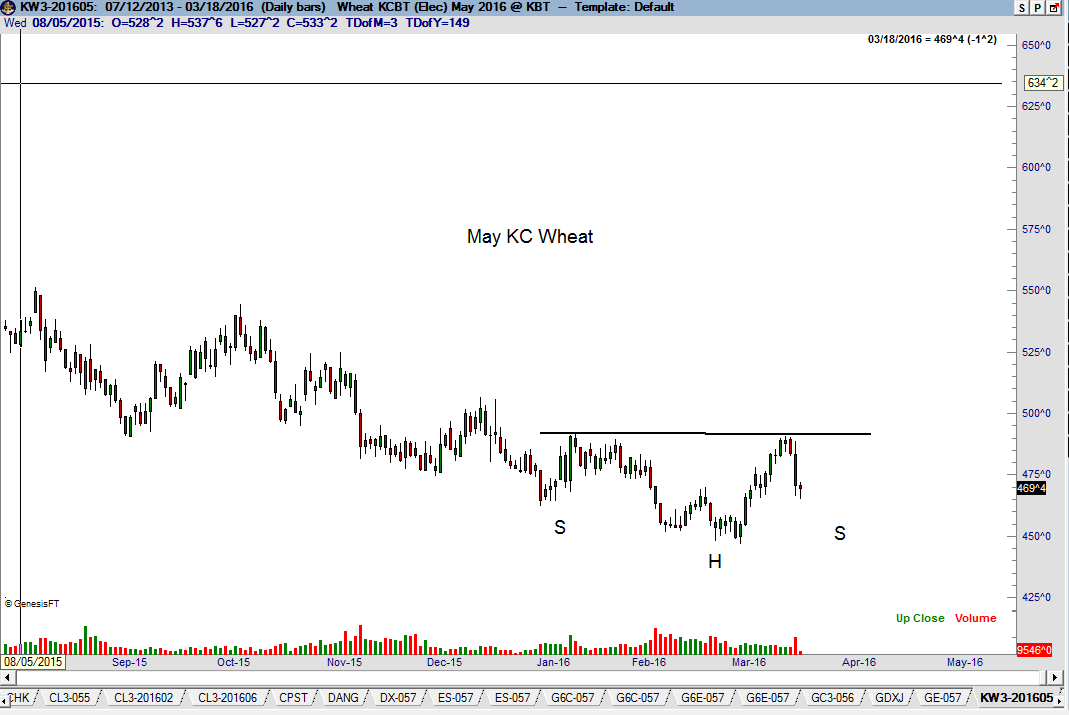
the charts of the individual contract months tell the same story. Second, it is a diagonal down-slanting neckline. A close above the right shoulder high of 910 is technically required to complete the bottom. A neckline violation alone is insufficient evidence that the H&S pattern has been completed. Note: Friday was a minor bearish reversal day on a short-term basis. The May Soybean Oil contract completed a continuation symmetrical triangle this past Monday. This pattern has an implied profit target of 35.00, which is also the area of the Jun 2015 high. Note: Friday was a minor bearish reversal day on a short-term basis. The daily graph of Kansas City Wheat displays a possible H&S bottom pattern. The main problem with this pattern is that it could easily morph into a rounding bottom – and rounding bottoms are very difficult to trade. Factor is long Soybean Oil with an extremely tight stop.
See Soybean Oil and Wheat charts.
Understanding the Factor’s Approach to Achieve Profitability
All long-term successful traders I know have different performance profiles. Using American baseball as a comparison, some of my trader friends hit mostly singles. Some hit a lot of doubles and with an occasional triple
and are good at stealing second base. Other swing for the fence, willing to make a trade-off between batting average and RBIs. I know some traders whose net performance each year comes from just a few huge moves. I know other
traders whose net performance comes from 100 or so small scalp and swing trades.
Let me explain how I view the accumulation of trading profits relative to my approach to market speculation. An independent audit of trading records from 1981 through 2010 established Factor’s compound annual ROR at 41.6% with four losing years averaging (4.7%) – the worst year at (8.4%). I have been profitable since 2010, but I do not detail performance unless it has undergone an independent audit.
It is my hope to produce a 30% to 35% ROR in 2016 – we will see if this occurs. If successful, the net profit will most likely come from seven or so trading themes that produce an average profit of 500 basis points (5%). In 2016, I anticipate I will be engaged in approximately 50 different trading themes. In other words, if successful, the net bottom line will come from 15% of the trading themes.
Let’s consider the trades constituting the 15%. I primarily trade futures and spot forex. My typical trading size is 7 to 12 futures contract per $1MM of trading capital (or a forex position with an equivalent USD value of $800K to $1MM per $1MM of trading capital). Examples of trades delivering 500 BP would be:
- A 400 point advance in Yen futures sized at 10 contracts per $1MM
- A 150 point move in S&P futures sized at 6.7 contracts per $1MM
- A $100 move in Gold sized at 5 contracts per $1MM
- A $7 move in Crude Oil sized at 7 contracts per $1MM
- A 430 pip move in EUR/GBP sized at €800,000 per $1MM
- An 80 cent move in Soybeans sized at 12 contra$1MM
These are the kind of moves I need to patch together for a 35% year – with one major condition. The condition is that the other 85% of trades cancel each other out. This means I must be super diligent and aggressive with my risk management practices. If I become sloppy and take big losses, then the entire formula is disrupted.
My historic win rate is around 42% — this means that 21 trading themes will be profitable. Thus, the bottom-line trades (the 15% of total trades) will represent roughly 1/3rd of all winning trades. This means that the remaining 27% of all trades (42% win rate minus the 15% bottom-line trades) must compensate for the 58% of trades that will be loser or breakeven events.
The formula, then, can be reduced to three components:
Total trading themes = 50
- Bottom-liner themes = 7 themes delivering an average of 500 basis points each
- Minor winning themes needed to offset losses = 14 themes delivering an average of +60 BP each
- Losing/breakeven themes = 29 themes losing an average of (30 BP) each
These are the metrics I care about. These are the metrics that will produce the type of year I seek. The reality, though, is that the trading environment is different every year. This is a subject for a different day.
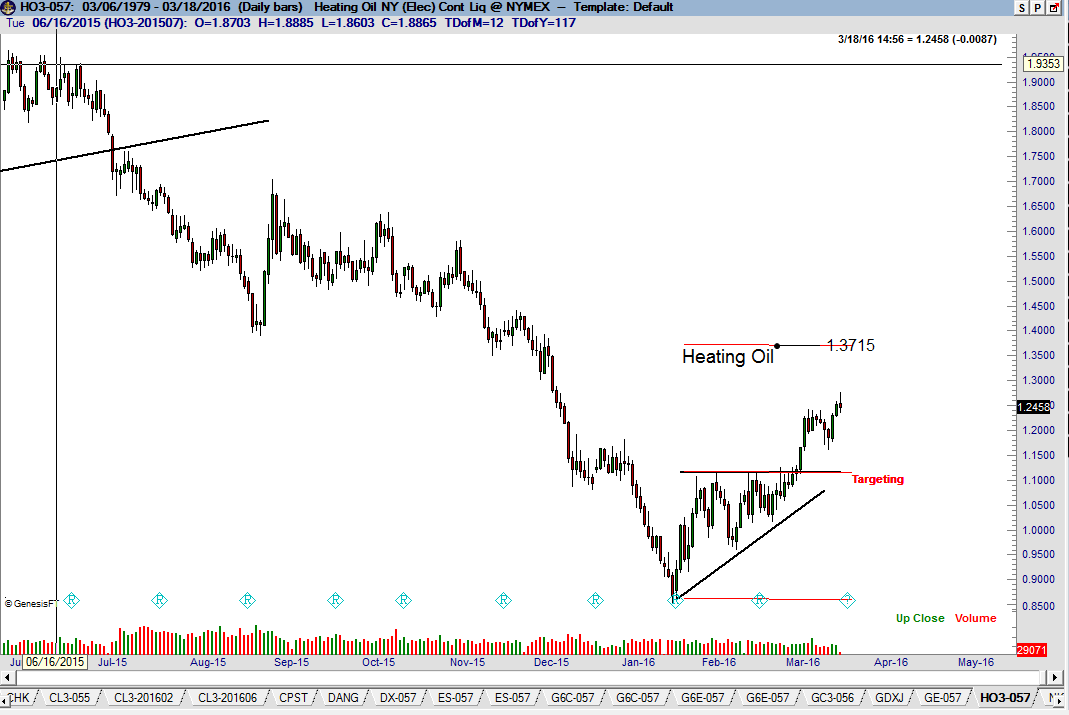
Heating Oil (daily chart)
The Factor is focused on identifying well-defined patterns at least 12 weeks in duration. Periodically patterns of shorter duration appear that are appropriate for the swing traders among you. The advance on Mar 4 completed a small ascending triangle in Heating Oil. I prefer patterns that break out of a horizontal boundary. I avoid patterns that break out of a diagonal boundary. The implied target in Heating Oil is 1.370. Note: Friday was minor reversal
day on a short-term basis. Factor is flat.
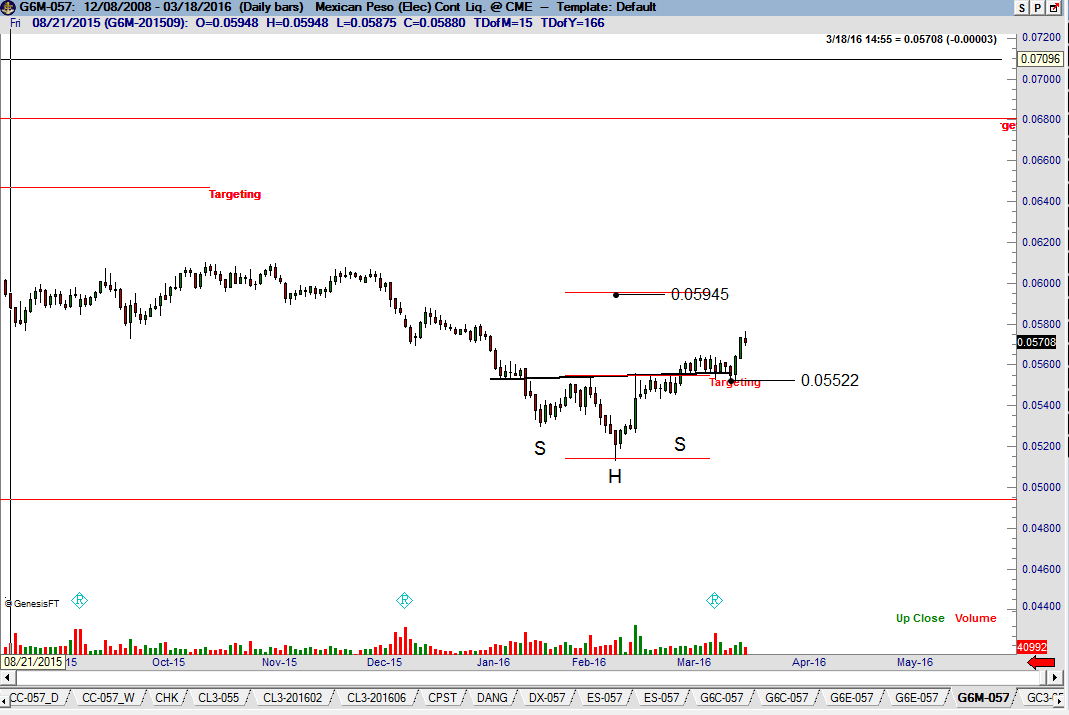
Mexican Peso (daily chart)
Factor’s overall bearish bias on the Peso has been consistent and steady since Oct 2014. The Peso was been a very profitable market for Factor from Nov 2014 through Jan 2016. While I believe the Peso has considerable downside left to go, the recent rally has completed a small H&S bottom with an abbreviated right shoulder. This is a swing trade with an implied target of .05945. A move below .05520 would negate this analysis. Note: Friday was a minor bearish reversal on a short-term basis.
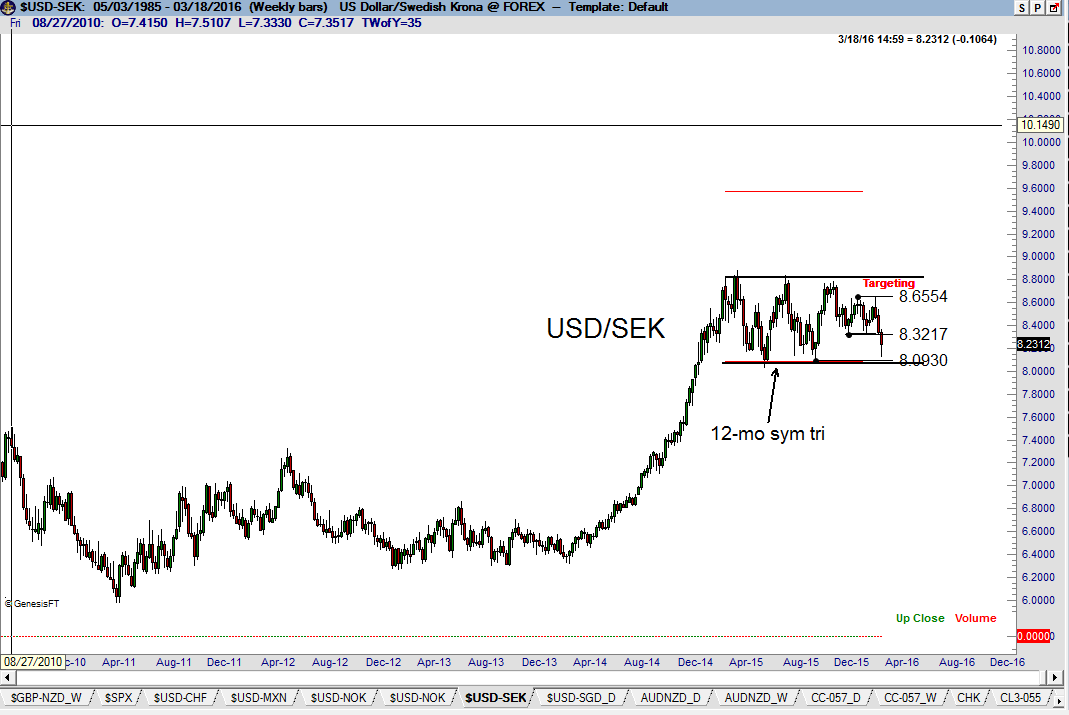
USD/SEK (daily chart)
The dominant chart construction in this forex pair is the ongoing development of a 12-month rectangle on the weekly graph. As long as I remain short USD/NOK, I am unlikely to short USD/SEK. However, should the cyclic bull trend in the USD re-emerge (see DX), this cross might offer an outstanding opportunity on the long side. Factor is flat.
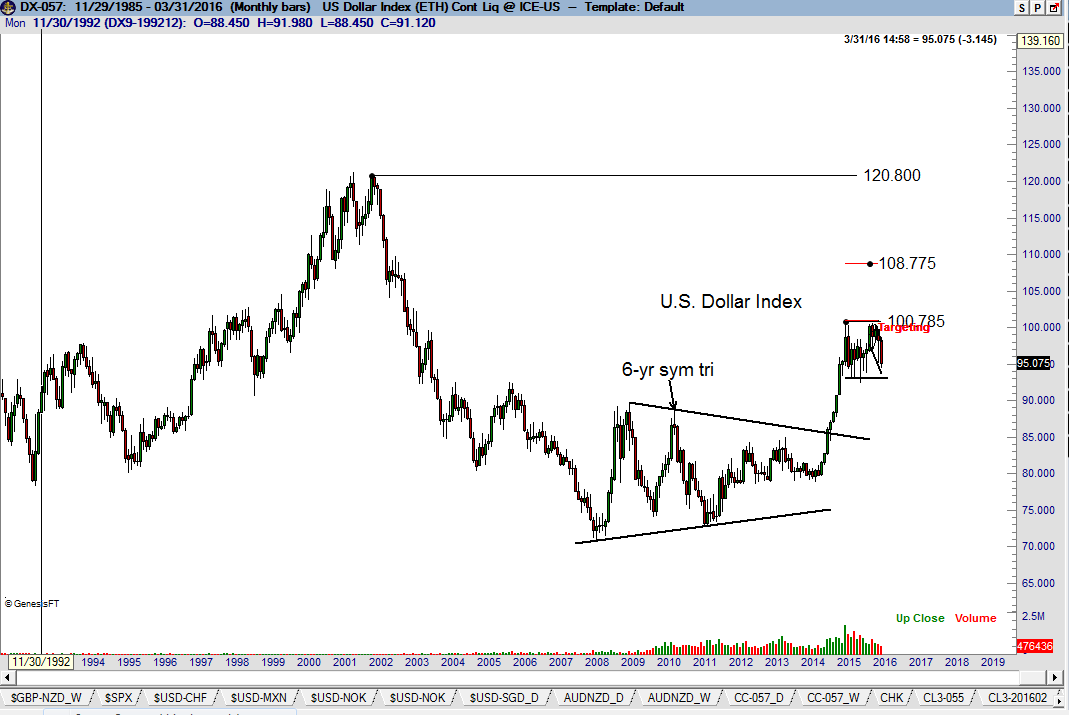
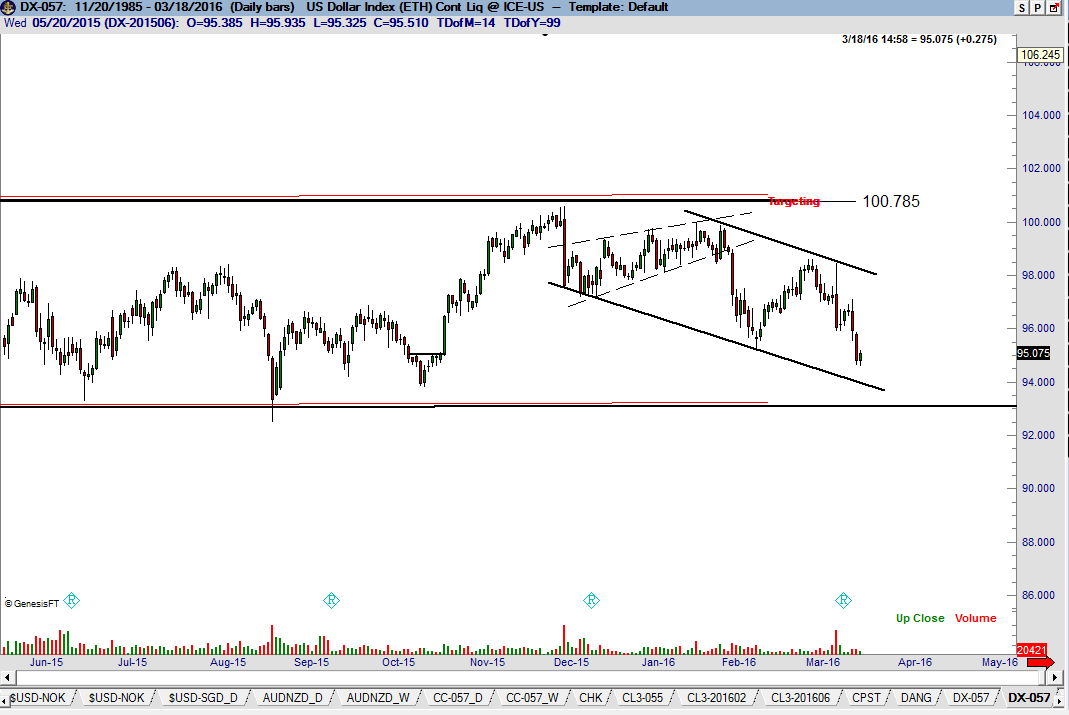
U.S. Dollar Index (monthly and daily charts)
My opinion on the USD is well known and long standing. In summary, I believe DX entered a cyclic bull trend starting with the Sep 2014 completion of a massive 6-year symmetrical triangle on the monthly graph. I further believe that the current one-year trading range is just a resting period that should lead to another strong advance toward 108.70 and then 120.80. I am flat and have no desire to pick a bottom on the daily graph.
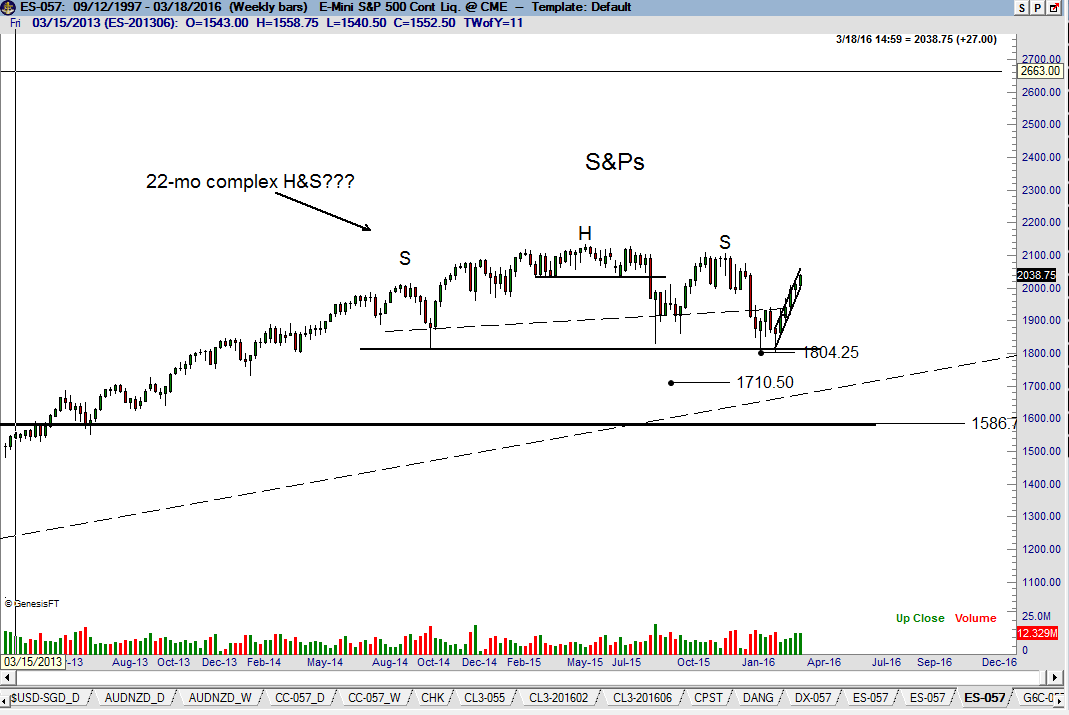
U.S. stock market (weekly chart)
I would be lying if I told you I knew what was going on in U.S. stock indexes. I do not have a clue. The current advance is stout. I have a bearish bias, but I have no desire to pick a top. I also have no desire to be long any of the stock index futures. The S&Ps continue to construct a possible complex top. My preference identify individual stocks breakout out of solid continuation patterns.
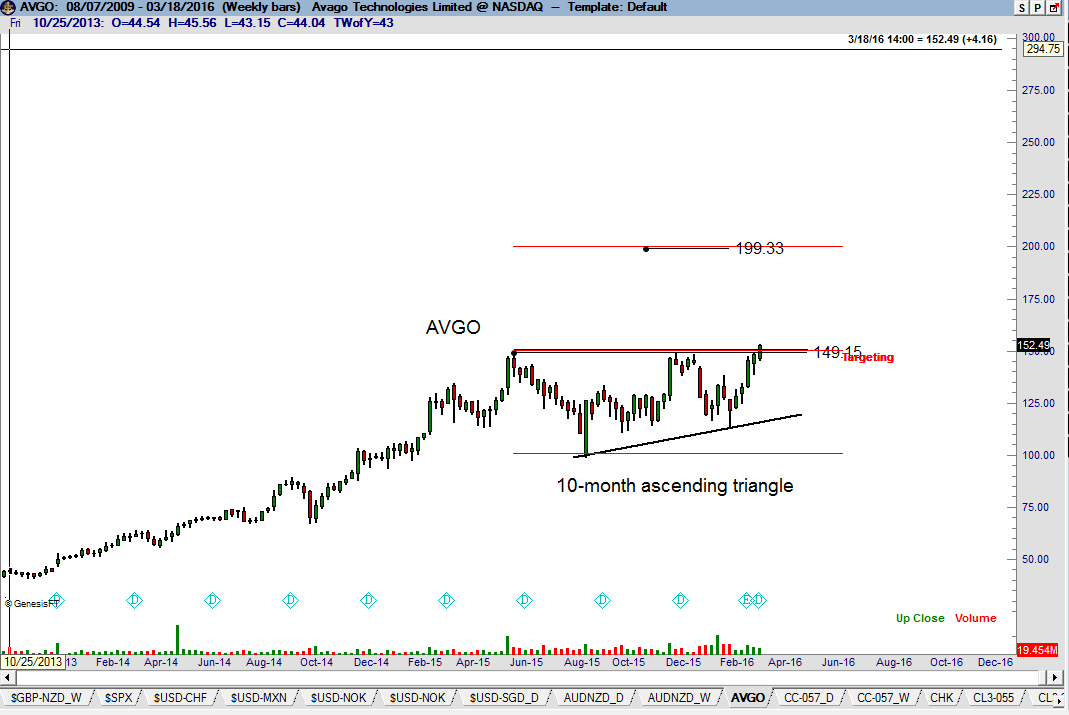
AVGO
This stock completed a large cup and handle pattern this past week. I purchased AVGO on Thursday. This stock has a target of just under $200. My risk is to $142.89.
Anatomy of a trade – USD/NOK
The overwhelming majority of markets are in a state of confusion the overwhelming majority of time in terms of classical charting principles. I find no need to “study” a chart.” If a pattern does not almost instantly pop off the computer screen it is time for me to scroll to the next market on the list. For me, potential trades are almost instantly recognizable.
But, even clearly defined “no-doubt-about-it” chart patterns are anything but easy money. Often the real work for a trader begins once a pattern has been positively identified. It is easy to form an opinion about a market – trading
it is a completely different matter. The four most common outcomes from a “no-doubt-about-it” chart configuration are listed below:
A. A textbook pattern forms, the pattern completion is decisive, little or no retesting of the completed pattern occurs, and the market drives to the implied target in a sustained manner. These are bottom-liner trades.
B. A very well-defined chart pattern is completed only to have the market immediately reverse. More often than not such occasions are followed by chart morphing wherein the initial pattern becomes part of a longer and more complex trading range.
C. The breakout proves to be a giant bull or bear trap, immediately followed by a thrust in the opposite direction.
D. The breakout stalls and prices move back into the completed pattern – but the breakout was simply premature and the real breakout occurs within days or weeks.
Any of the above possibilities can – and do – occur over the course of a year.
Against the above backdrop, several aspects of Factor’s risk management and trading
tactics should be explained.
- An attempt is made to preposition a pattern – establishing a layer prior to the completion of a major pattern
- Additional leverage is established when a pattern is completed – intraday in some cases, on a closing price basis, or both
- Once a trade “pulls out of the station” I give it plenty of opportunity to work as long as red ink does not appear
- I have no tolerance for a trade that starts to dig back into my pocket. Capital preservation trumps my opinion of any given chart.
- I am willing to give a big pattern two attempts – then I will let the market do whatever it will do
The chart below provides an overview of the 4+ month H&S top in USD/NOK. A chart detailing my trading action is on the next page.
Short Layer #1 (next chart)
- Previous Factor Updates mentioned that the right shoulder of the H&S was taking the form of a possible bear channel. Accordingly, I shorted a layer on Mar 3 when the channel was violated intraday.
- Note that the WBB decline on Mar 4 penetrated the dominant trendline dating back to the Aug 2014 low. But, the H&S top was not completed – and its completion would be my next shorting opportunity.
Short Layer #2 (next chart)
- After drifting sideways for four days, the WBB decline on Mar 11 sliced through the neckline of the H&S top. I added another layer of shorts. At this point my entire trade represented an 80 BP risk to the initial protective stops. I considered it a very good sign that the H&S top was completed on a Friday. Friday pattern completions have the highest reliability.
- The inside day on Mar 14 closed back above the neckline and put Layer #2 into a loss. This was a yellow flag for me in terms of capital preservation. Accordingly, I moved the protective stop on Layer #2 to above the Mar 14 high.
I also moved the stop on Layer #1 to above the Mar 11 high. These two stop levels, if activated, would allow me to escape the trade with no skin lost. - Both of my stops were triggered by the advance on Mar 15. Even though I was out of the trade, I still believed that the H&S interpretation was correct and that the Mar 11 decline was simply a premature breakout (see item D on the list above). Thus, I was ready to give the trade another try on any meaningful sign of renewed weakness.
- Mar 16 was a bearish engulfing candle. This was enough for me to take action. I re-shorted the cross – but with only 45 BP of risk. Generally I will scale down my leverage on the second attempt in the same theme. My target is 8.0411 and my protective stop is at 8.5051. This is my last attempt at this crossrate. There is a real psychological danger for traders to become obsessed with catching a move. This is a trap I attempt to avoid. The two-strike rule protects me from falling into this trap.

I am a 100% discretionary trader when it comes to identifying candidate trades. I am a 50% discretionary/50% rules-based trader when it comes to trade entry. I am a 30% discretionary/70% rules-based trader when it comes to managing an open trade. Sometimes the rules are in sync with price action. Sometimes they are not in sync with price action. USD/NOK has been a market where by chart interpretation has been spot on, but my rules-based trading tactics have been out of sync with price action. Welcome to the world of trading!
Could I create a different set of rules that would have been better aligned with the price action of USD/NOK? Of course – this is a no brainer. It is easy to modify trading rules based on the last trade or series of trades. But, trading rules CANNOT be optimized. I have trading rules and guidelines, I step to the line and place a bet and live with the results. In the world of discretionary trading, coulda-woulda-shouldas are not allowed. Traders do not have the luxury of trading yesterday’s markets.
plb
###


