
ChartWizards Actual Alpha – April 29, 2026
This content is for members only

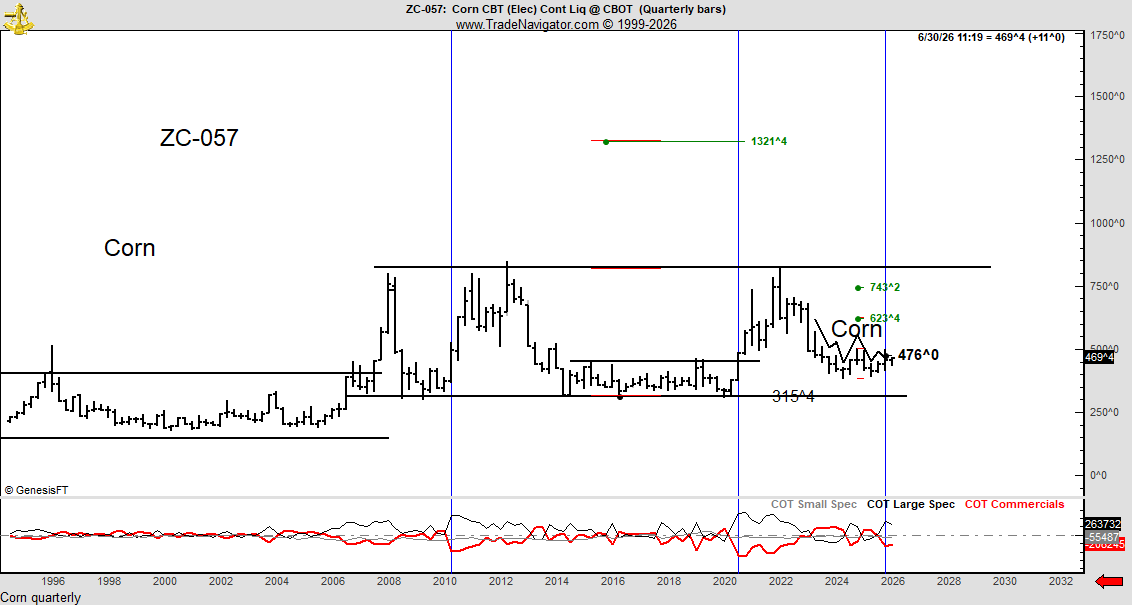
Corn prices have remained in a broad trading range since 2008. This range on the quarterly chart has taken the form of a rectangle. My eventual target is 13.20, but is the market ready for that move yet? One argument that can be made against an advance in Corn at the present time is the extensive short position of Commercials. Often tops in grain markets occur when Large Specs become big long holders and Commercials become the big short in the markets. Yet, note the vertical blue lines in 2010 and 2020 when massive rallies began with historically large net short positions on Corn by Commercials.
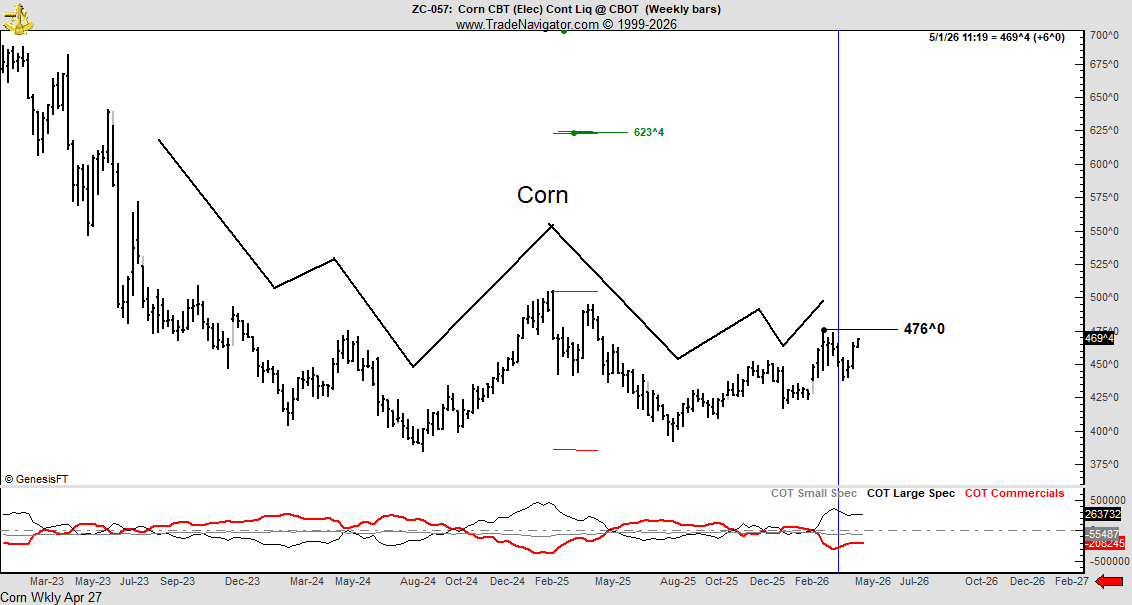
The weekly chart exhibits a rare compound fulcrum pattern. An advance above 4.76 would complete this pattern and establish an inital target of 6.23.
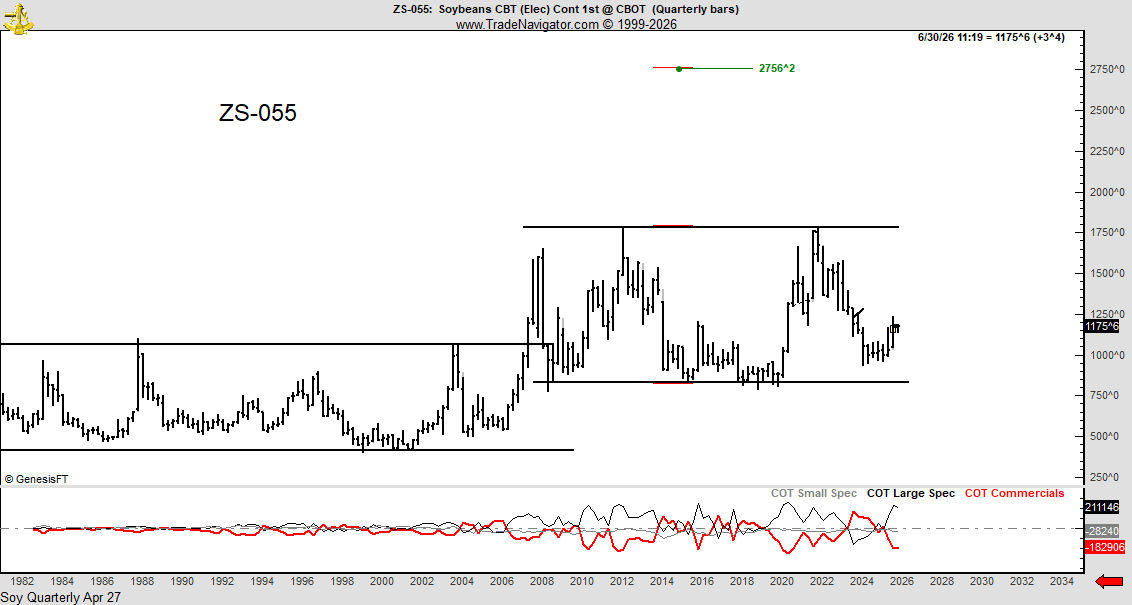
The quarterly chart of Beans has been forming a massive rectangle, similar to the rectangle that launched an $8 per bushel rally in 2007.
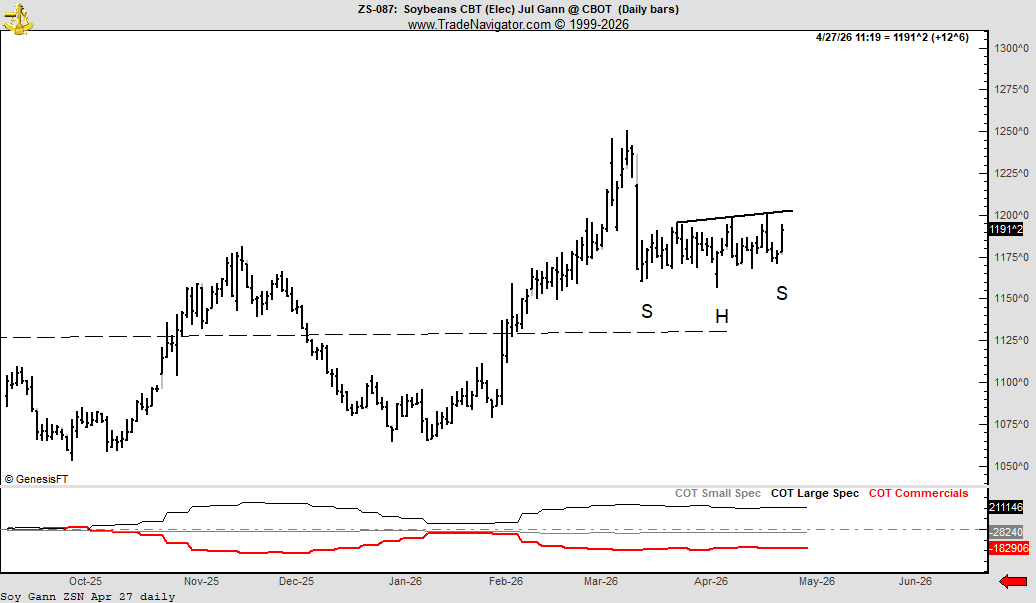
The daily chart of the Jul contract of Beans displays a possible “sling-shot” inverted H&S pattern. This is the type of pattern that can launch a breakout of larger scale patterns. Traders could use a breakout of this daily chart pattern to play the possibility of an advance on the longer-term time frame charts.
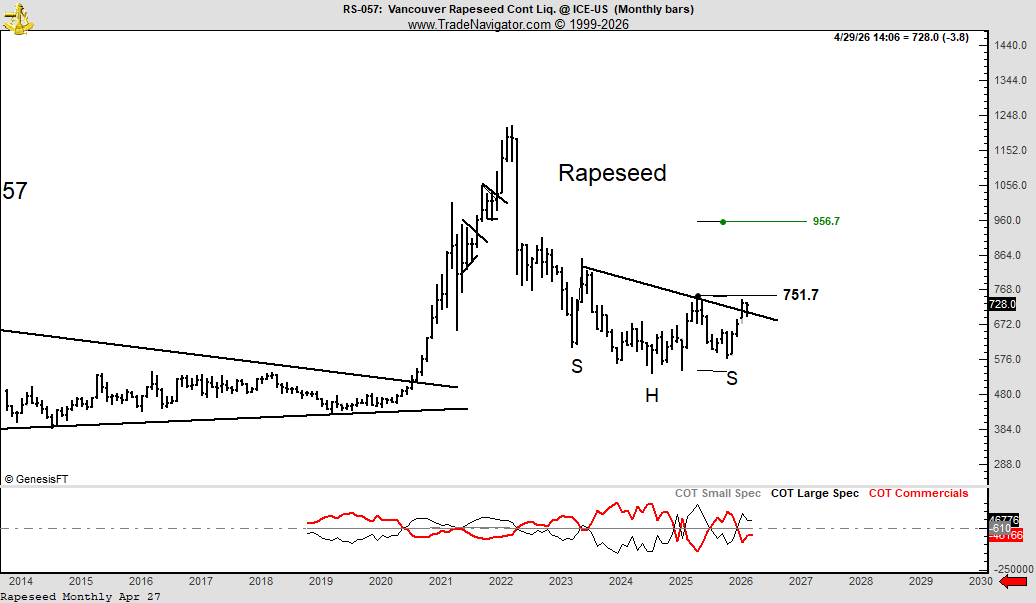
The monthly chart of Rapeseed displays a possible multi year inverted H&S pattern. This pattern, if completed, would produce a target of 9.56 or so.
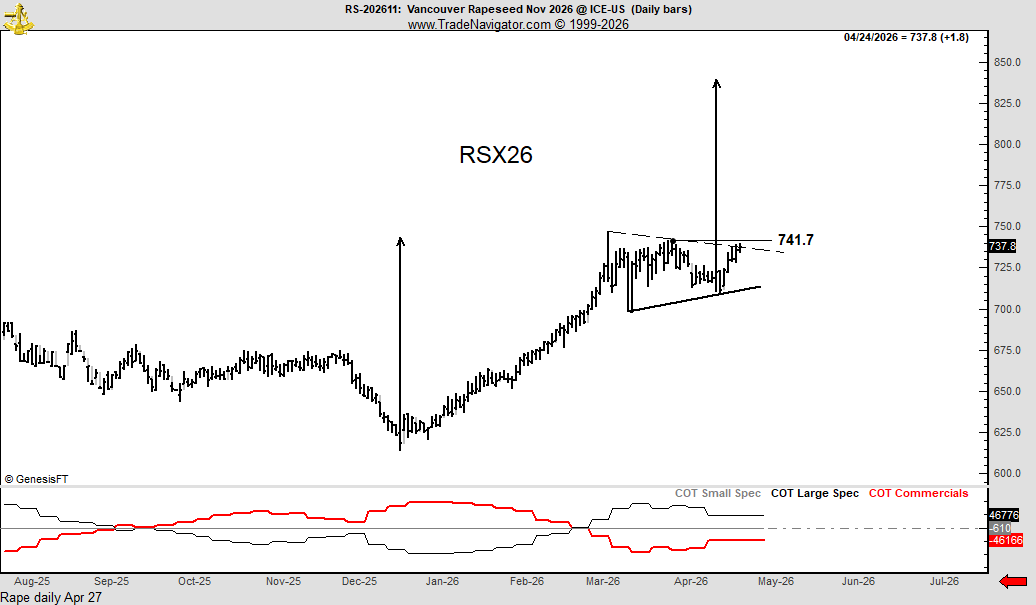
The daily chart of the November contract is forming a possible continuation symmetrical triangle. Forming after a sustained rally from Jan – early Mar, this triangle could be of the “half-mast” variety would suggest an advance to 840.
As always, trade within the size of your account and always use protective stops.
For ongoing analysis of grains and other markets using classical charting principles, subscribe to The Factor Report at:
End.


![]()
