A chart analysis of the Swiss Franc
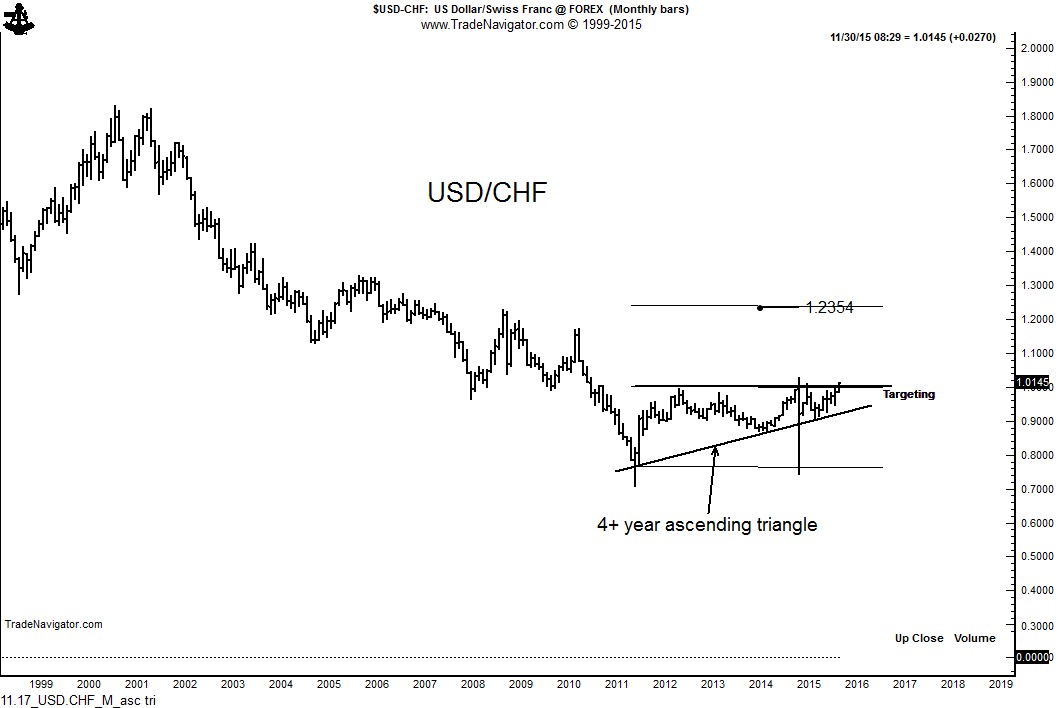
Charts indicate that the USD/CHF could trade at 1.1200 and perhaps as high as 1.2350.
Swiss National Bank is intent upon driving the Franc lower (i.e., USD/CHF higher)
Note: This report represents the type of analysis routinely provided to members of the Factor Service. Members of the Factor Service have been advised for three weeks to be long USD/CHF. For information on the Factor Service, click “Subscription” on the upper menu bar. The membership rate for new members to the Factor Service will be increased by $100 per year beginning January 1.
When analyzing the charts of a commodity, stock or foreign exchange pair, it is always best to start with a long-term view and work towards the shorter-term.
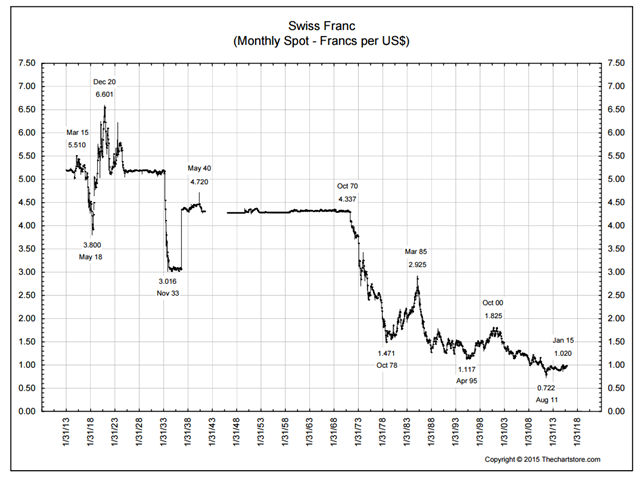
The 100-year chart of USD/CHF shows that the USD is extremely cheap in historical relationship with the CHF, as shown below. Market observers who believe the USD/CHF cross is overheated do not have a clue. The clueless bunch were screaming “overbought” on USD/JPY back in Jan 2013 when the cross was under 90 to 1, on its way to 123 to 1.
The monthly graph is USD/CHF is extremely revealing. As a chartist, I ignore price action that is extremely short-term and clearly caused by Central Bank manipulation. This is the case with the monthly graph. The chart displays a 4-year ascending triangle. The current advance is attempting to complete this massive base area. A decisive close above 1.0150 would complete this pattern and establish an upside profit target of 1.2350. Of course, the market is likely to create a number of consolidation areas on the road to this target.
One might ask: “Why is the CHF exhibiting such weakness?” “Does the Swiss National Bank want a weaker Franc (stronger USD/CHF)?” The answer is a resounding YES!!!.
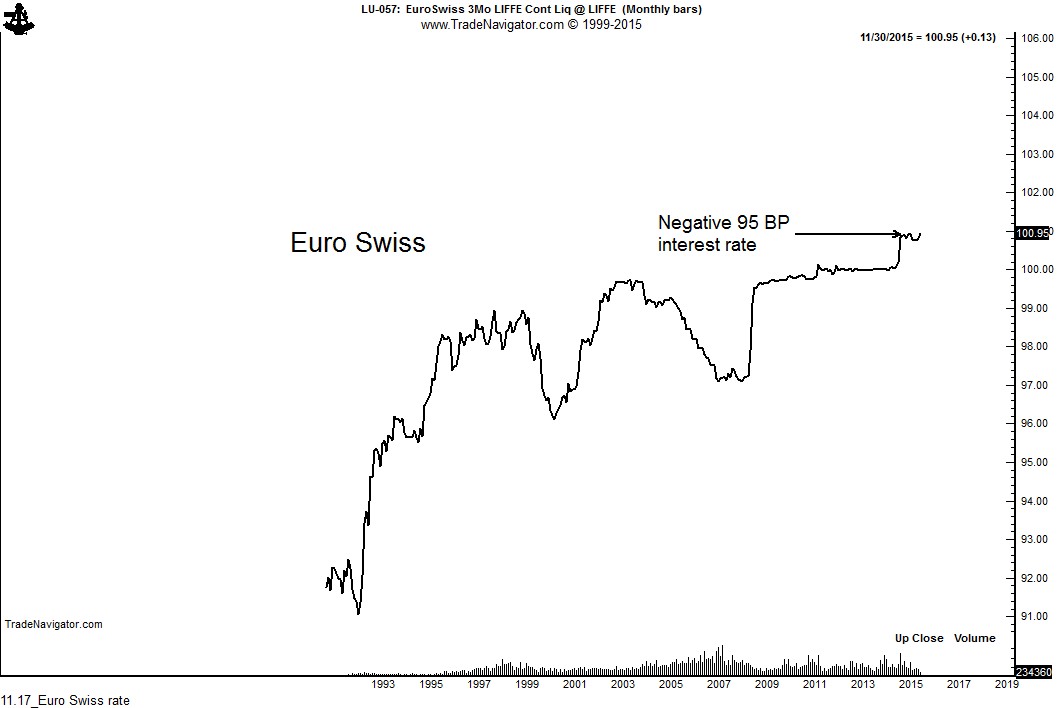
The chart below is the monthly EuroSwiss interest rate. The rate is currently a negative 90 BP. This means that any entity holding Swiss Francs must (in effect) pay 90 BP for the right to be long Francs. What a deal!!!
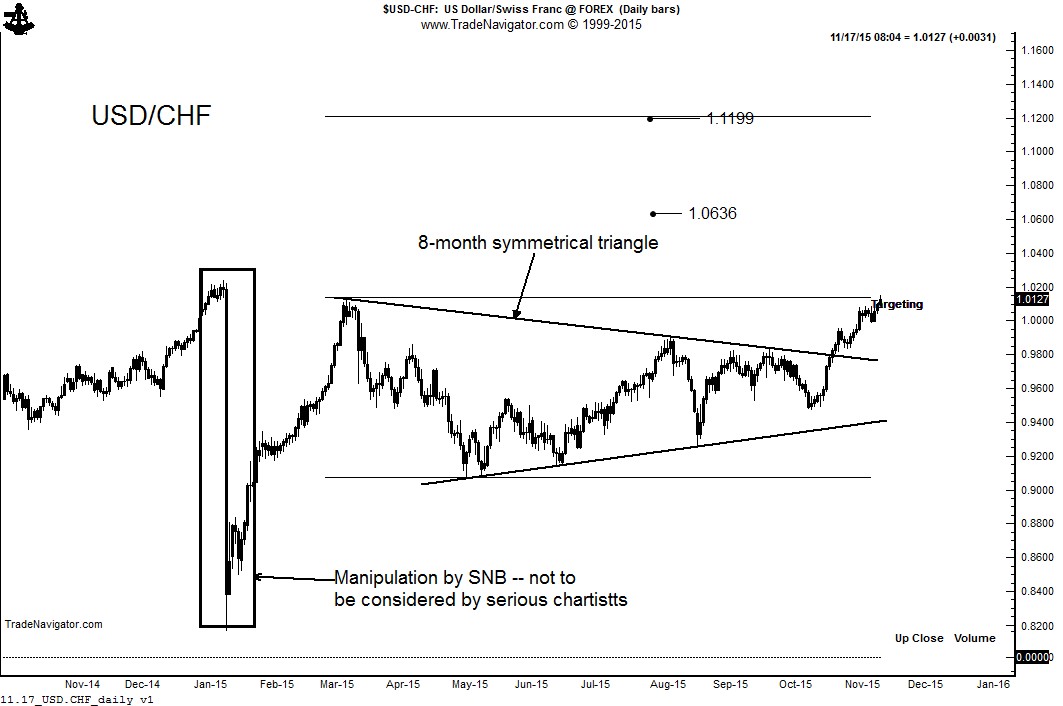
This graph is a clear indication that the SNB is engineering a weaker Franc (higher USD/CHF). Finally we will look at the USD/CHF daily price graph. The dominant feature of this graph is the completed 8-month symmetrical triangle pattern. The targets of this pattern range from 1.0636 to 1.1200.
Conclusion: A major bull trend in USD/CHF has commenced. This trend should be strong, sustained and extended. Factor is fully long the crossrate.
Markets: $USDCHF, $6SZ_F #SWISSFRANC
plb
###


Leave a Reply
Want to join the discussion?Feel free to contribute!