Factor Update – August 7, 2016
This content is for members only
This content is for members only
This content is for members only
I hate to be the bearer of bad news to some of you, but taking losses is the primary job description of a market speculator. If Losing Trades offend you or upset your emotional chemistry, if you consider “being wrong” to be a character fault or a “problem” with your trading approach, if you even think that the marketplace cares what you think or what you do, then market speculation is probably not for you. Trading is mostly an exercise of throwing mud against the wall to see what sticks – and most lumps of mud fall quickly to the floor. I have known many extremely profitable career traders over the years and very few of them have a win rate in excess of 50%. Almost to a person, these traders view taking losses (many losses) as the process of finding winners.
The dominant construction on the Cotton Chart continues to be the completed 24-month double bottom on the weekly Cotton Chart. The targets of this bottom are 79.10 (the measured move) and 95.10 (May 2014 high). The Dec contract was launched by a 5- week pennant. Factor is long, having taken partial profits.
This content is for members only
This content is for members only
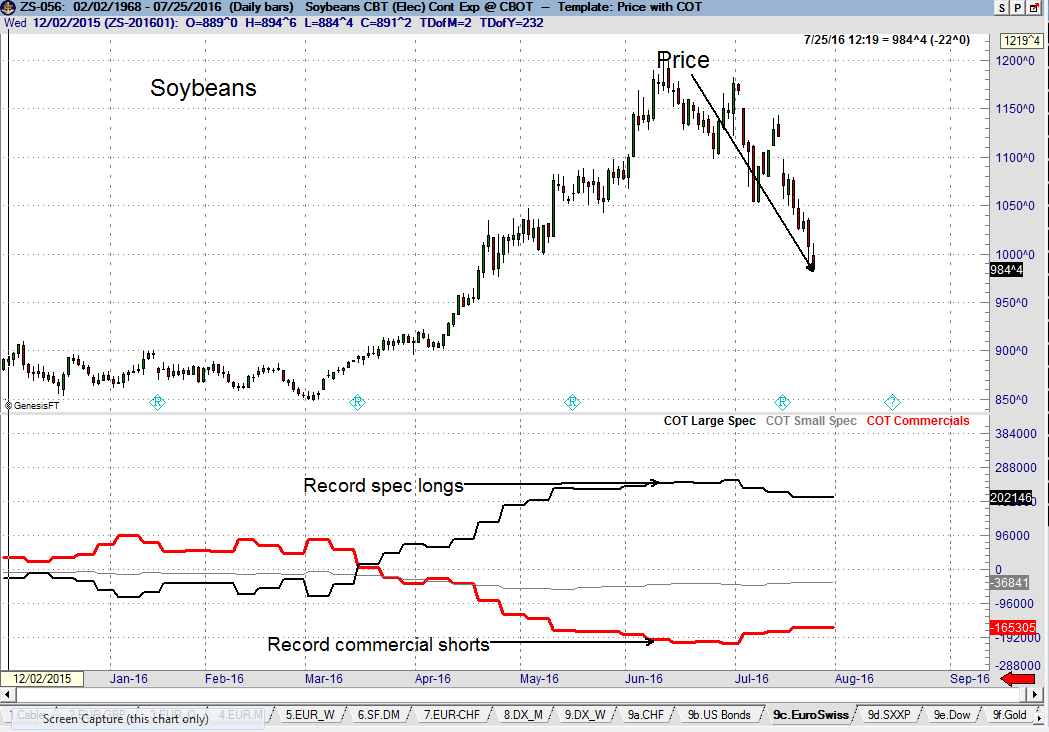
It is not my intent to make it rain on the Silver bull market parade -- nor should this email be taken as a prediction -- but all-time record levels of speculative long (or short) positions and commercial short (or long) positions MUST be taken seriously.
Keep in mind that record CFTC COT levels, in and of themselves, do not demand a reversal of trend. In fact, some of the biggest moves in history have come from capitulation by commercial traders.
Nevertheless, consider several other recent examples of record (or near record) speculative long (or short) positions and commercial short (or long) positions.
This content is for members only
Bottom-line winners and junk-pile trades, part 1: How they all contribute to Factor’s trading operations and performance.
Part 2 of this series will focus on Bottom Liners.
Part 3 of this series will focus on the Junk Pile of lesser profits and losers
This content is for members only
![]()
