Live Cattle charts confirm a major top

A major top has been confirmed on the Live Cattle price graphs, projecting significantly lower prices.

The weekly continuation graph completed a 14-month H&S top on Aug 21. The general target of this top is sub-120.
9.16_LE057_W
Read More

The bearish case in Silver is back on the table

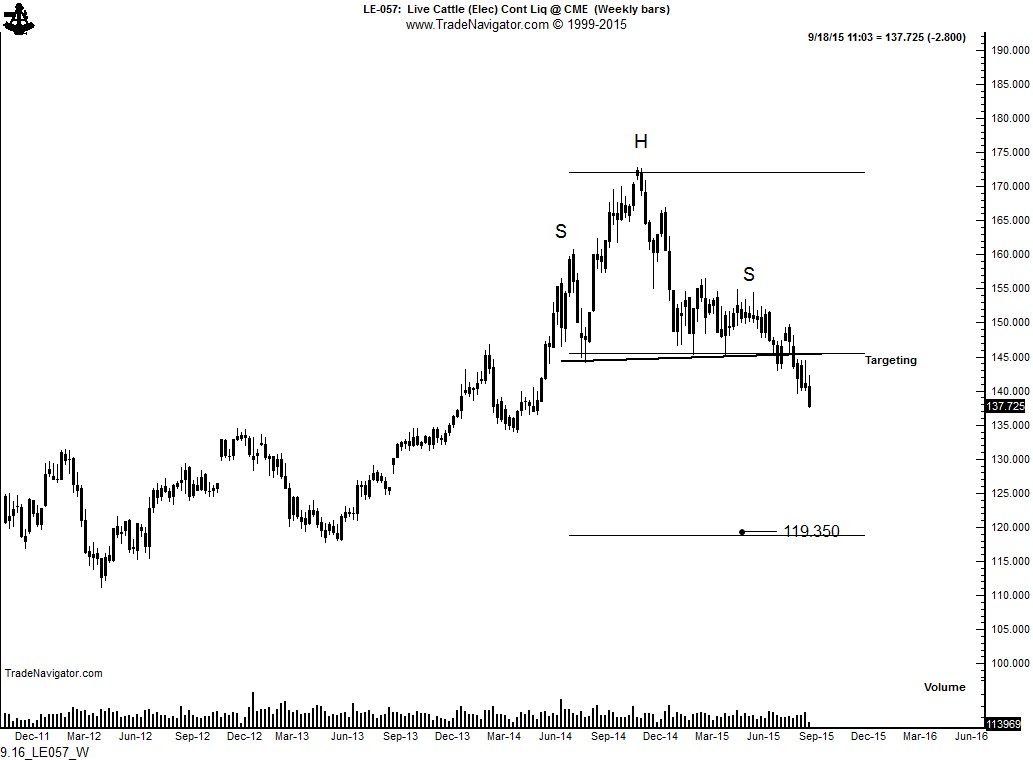
Seven month symmetrical triangle has been confirmed

Decline on August 25 triggerd an 8-week H&S failure

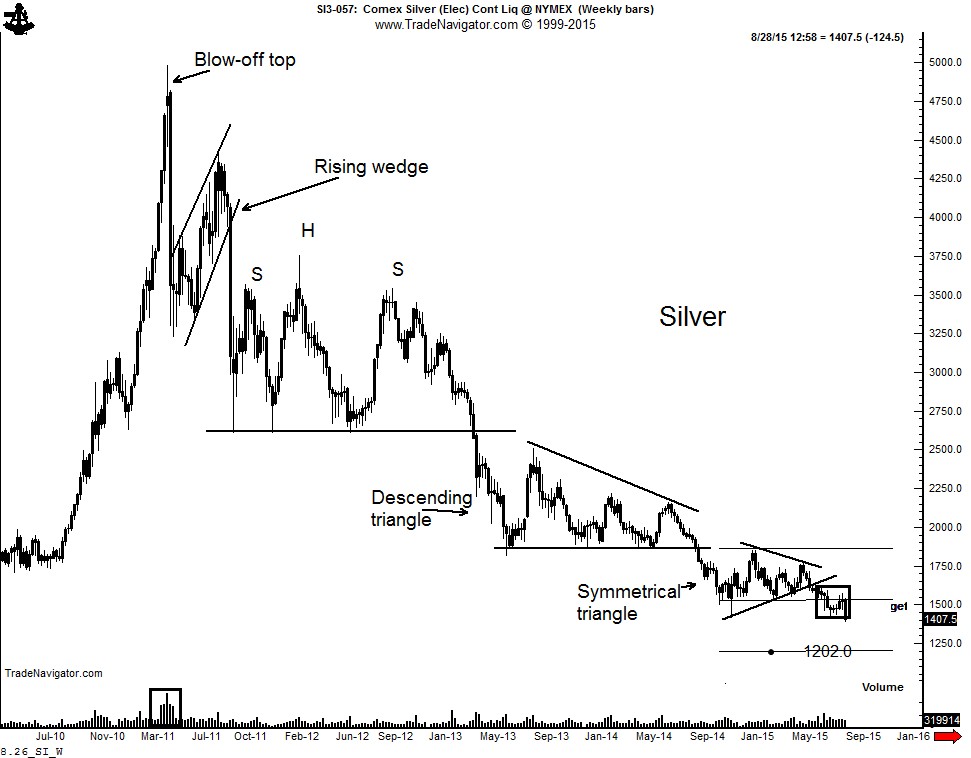
In recent weeks I have presented to members of the Factor Service the possibility that  why The Silver chart is a textbook example of the veracity of classical charting principles. Some of the features on the weekly graph include:
  • The blow-off top in April 2011 accompanied by record blow-of volume
  • The rising wedge retest of the top completed in September 2011
  • The continuation H&S pattern completed in April 2013
  • The descending triangle completed in September 2014
  • The symmetrical triangle completed in June 2015
8.26_SI_W Read More

A preview of the August 23 Factor Update — S&Ps

This content is for members only

Afraid to short S&Ps because it is oversold?????

This content is for members only

Chinese Yuan (USD/CNH) experiences historic breakout — next stop 6.8000

This content is for members only

History of Gold in Charts — Updated Version

This content is for members only

A bearish chart case for RB Gas

This content is for members only

S&Ps — a breakaway down gap is very possible

This content is for members only

US Dollar is set to gain against the Chinese 元/圆 (Yuan)

This content is for members only