See what I said about Crude Oil on August 11, 2014
This content is for members only
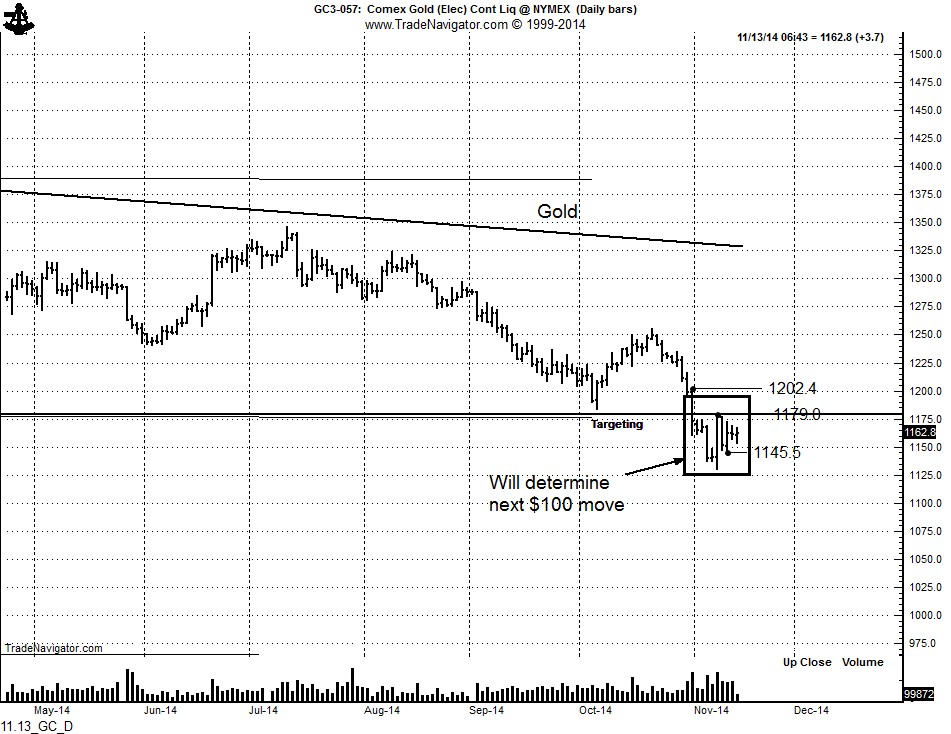
Keep your eyes on the precious metals. Gold and Palladium could be bottoming. A decisive close by Gold above 1180 and then above 1202 would be strong indications that the 3+ year bear market has run its course.
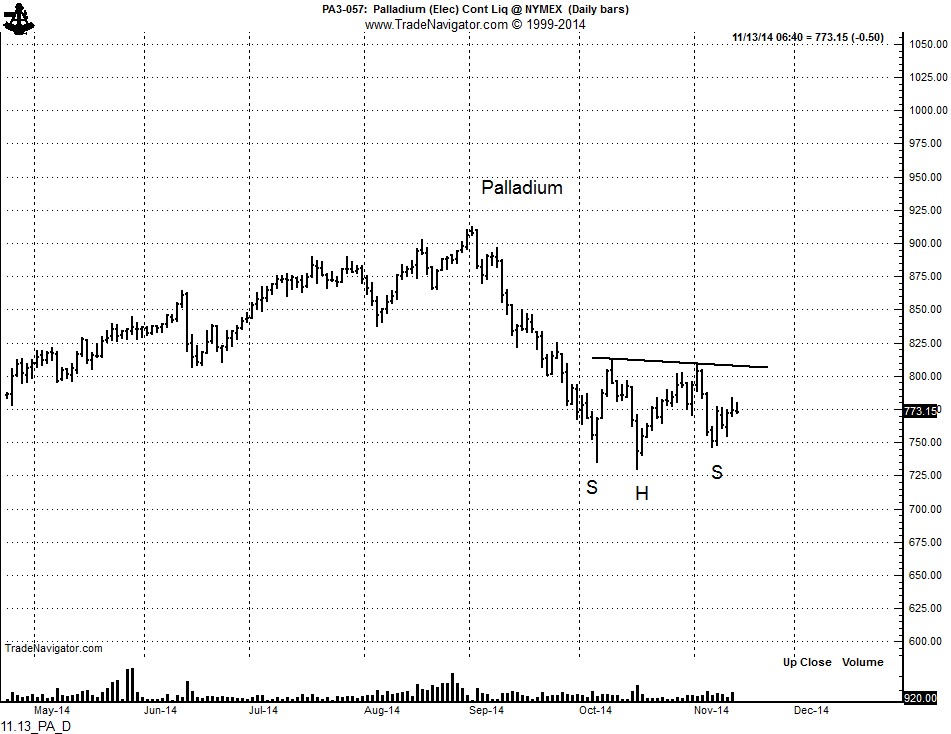
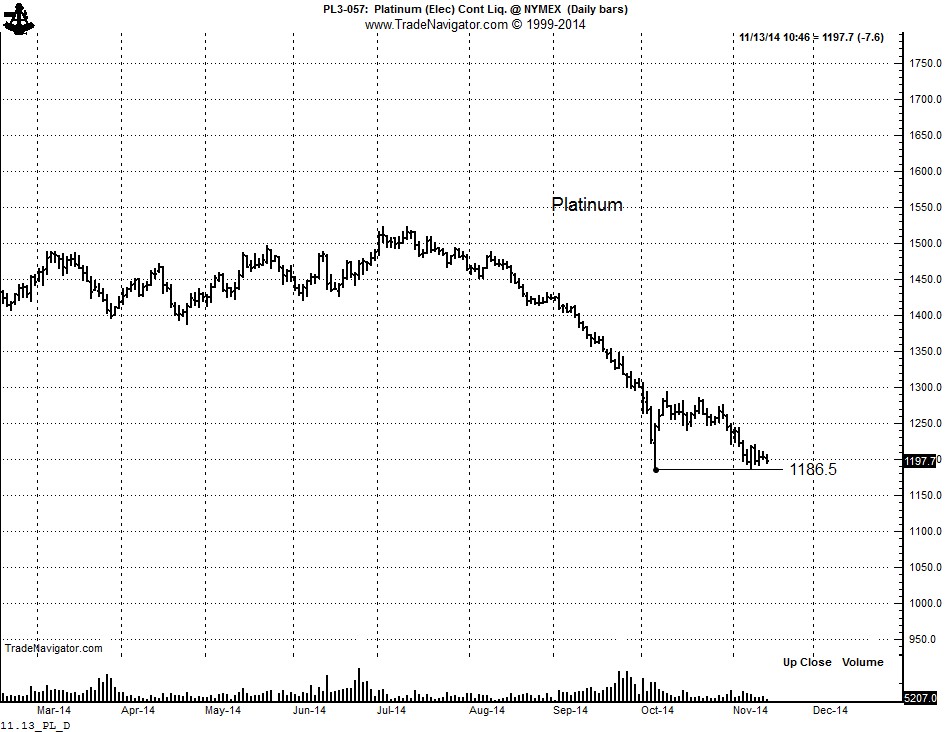
Palladium is forming a 9-week H&S bottom pattern. The key levels to watch for the next direction are the Nov high at 809 and the Nov low at 746.25. More bearish is the Platinum chart. A new low under 1186 would not be constructive.
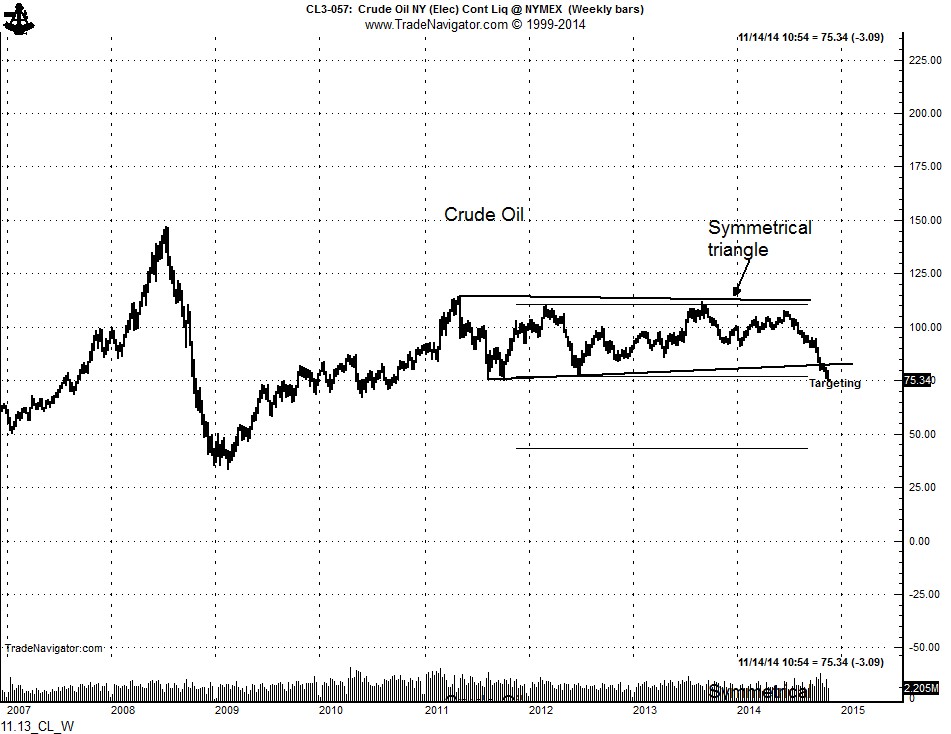
The weekly Crude Oil chart explains the current weakness. The 3-1/2 symmetrical triangle on the weekly chart has a target of $50. Look for real estate deals in North Dakota.
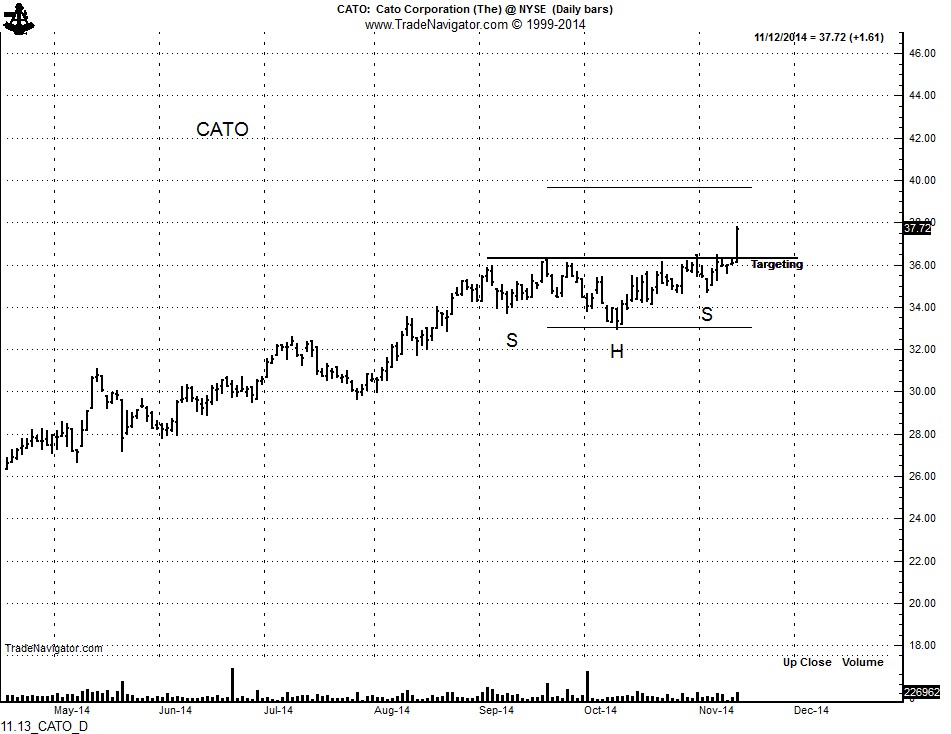
Kuddos to Factor member Paul S. for alerting me to CATO. On Tuesday he correctly interpreted the continuation H&S pattern in this stock and is profiting accordingly. Way to go, Paul.
###