The Public Blog site

stock market updates - Factor Trading - Peter brandt

Stock Market Updates

Stock Market Updates

It is with some discomfort that I am always pointing out potential tops in the U.S. stock market indexes. But, I must call them as I read them. The S&P daily chart has made ZERO upward progress in 18 months. A possible complex H&S top formation is under construction. Also note the appearance of a 7-week H&S top pattern. I am willing to short this smaller H&S pattern if given a well-defined risk point. I will give up on a bearish interpretation of the S&Ps if a new high is made – but this does not mean I would have any interest in being long in new high territory.

The Nasdaq is tracing out a possible broadening top, although as I have pointed out in recent updates, the rally from the Feb 2016 low has exceeded the normal construction of a true broadening top. Outside of the Nifty (India), the Dow Utilities (dividend play) and the Japan Mothers Index, I have a hard time finding a futures market index I am willing to own.


S&P 500 completed head and shoulders top - Stock market updates - Factor Trrading - Peter Brandt


Nasdaq is tracing out a possible broadening top - Stock market updates - Factor Trrading - Peter Brandt

plb

##

bullish on the US dollar index - Peter brandt - Factor Trading

Bullish on the US Dollar Index


US Dollar Index

I remain bullish on the US Dollar index. Like every other chartist in the world, I am well aware that the DX penetrated the important line of support at 93.00 this past week. I had absolutely no desire to short the apparent breakout of this level. In fact, I believe the decline below 92.00 was a gigantic bear trap – bringing in new shorts and washing out stalled longs.

A chart showing the recent CFTC COT data is also shown. Commercials have the smallest short position and large specs (hedge funds) the smallest long position since June 2014 – the month of the last major low in the DX. I am willing to “bottom-pick” DX should the 93.10 level be retested. My goal is to establish a 60 BP position near the lower boundary of the rectangle in DX. My long term target in DX is 120.00. Along the way I would like to build to a 100 to 150 BP position.


$USD bullish on the US dollar index - Peter brandt - Factor Trading 1


$USD bullish on the US dollar index - Peter brandt - Factor Trading 2


$USD bullish on the US dollar index - Peter brandt - Factor Trading 3


Factor Membership is now available.  You could consider your membership in the Factor Service as just one more trade. If the Factor Service is not of value to you, well, it is just one more trade that did not work.   Through the Factor Service I endeavor to alert novice and aspiring traders to the many pitfalls you will face – and to offer advice on overcoming those pitfalls. My goal is to shoot straight on what trading is all about.  For more information, visit the home page here.

I hope you will consider joining the Factor community.


sig


##


platinum continues to shine - peter brandt - factor trading

Platinum Continues to Shine

Platinum Bull Market

The dominant chart construction in Platinum is the completed 9-month H&S bottom on the weekly and daily graphs with an implied profit target of 1179. Note the near perfect Apr 25 retest of the neckline on the daily chart. The strength on Apr 28 goes a long way to confirm the H&S bottom interpretation.  Is this a Platinum bull market!


Platinum bull market  - Factor Trading - Peter Brandt - Platinum Chart $PL_F


Platinum bull market - Factor Trading - Peter Brandt - Platinum Chart $PL_F 2

Factor Trading is long Platinum and well positioned with a protective stop in place.  To consider Factor Membership options, please visit our home page for further details.  https://www.peterlbrandt.com


plb


##

Apple (AAPL) – Head and Shoulders above the rest.

Apple (AAPL) – Head and Shoulders (Pattern) above the rest.


As a trader, my favorite chart configuration is the Head and Shoulders. The H&S pattern is easily recognizable (although for reasons I will not go into here, the novice chartist falsely finds the H&S form everywhere), produces far more reliable trading signals than more frequent patterns and is found at major turning points.

Apple has formed H&S patterns at many major turning points in recent years. The Factor has identified, alerted members and traded many of the following H&S patterns in real time.

Chart traders need to keep their eyes on Apple. The H&S pattern, when it occurs in Apple, is always worth a trade. Truly, Apple is head and shoulders above the rest.

Apple - $APPL H&S Head and Shoulders pattern Apple - $APPL H&S Head and Shoulders pattern Apple - $APPL H&S Head and Shoulders pattern Apple - $APPL H&S Head and Shoulders pattern Apple - $APPL H&S Head and Shoulders pattern Apple - $APPL H&S Head and Shoulders pattern Apple - $APPL H&S Head and Shoulders pattern


Factor trading tactics explained

Identifying a pattern is a relatively easy task in which to gain competence. Trading a pattern once identified – now that is a horse of a different color.

How many times have you heard another trader say (or said to yourself): “I knew that stock XYZ was going to go up, and it did, but I did not make a dime on the move?

Trade signaling, in my opinion, is far less important to net profitability than is proper trading tactics and aggressive risk management protocols.

Factor LLC, in its proprietary account, traded two of the H&S pattern featured herein as follows (adjusted for splits, not adjusted for commissions):


2015 H&S top sell signal

Shorted the close on Aug 3 at 116.68 with an initial risk to 122.31, or a risk of $5.63 per share. The target was

103.22. Factor risked 60 basis points on the trade (6/10th of 1%), or $6,000 per $1MM of trading capital. A 60 BP trade represented a 1,000 shares position (actual initial risk was $5,630 per $1MM).

The protective stop was moved to 116.82 after the close on Aug 21. Factor takes profits when targets are met. The target was exceed with a gap down open on Aug 24 at 93.98. Factor maintains open orders to take profits at target levels. The profit for the trade was

$22,700 or 227 BPs.


8


2010 H&S top sell signal — then 2010 H&S failure buy signal

  • Shorted 2900 shares on the Aug 24 close at 31.71 with 60 BP risk to 33.71. Stopped out on the Sep 3 opening at 33.76 for loss of $5950 per $1MM, or 60
  • Factor considers the failure of a H&S top pattern to be a buy signal. Bought 2400 shares on Sep 3 at

34.24 with 60 BP risk to 31.79 and target of 40.79. AAPL reached target on Oct 15. The profit for the trade was $15,720 per $1MM or 157 BPs.


9


plb


###

Trading Futures and Forex related ETF's is a foolish way to manage trading capital - Peter Brandt

Trading Futures and Forex related ETF’s is a foolish way to manage trading capital


Why trade an ETF when the underlying Futures or Forex contract can be traded.

Trading an ETF tied to an underlying Futures or Forex market requires far more capital with less profit potential at the exact same level of risk as directly trading the underlying futures or forex contract. Five examples are provided to make my point.

  • S&P futures vs. SPY
  • S&P futures vs. SH (inverted SPY)
  • British Pounds futures vs. FXB
  • Gold futures vs. GLD
  • Copper futures vs. JJC

Assumptions:

  • An ETF represents a specific futures or forex market
  • A loss of $10,000 is risked per trade – in both the futures/forex and ETF expressions of a trade. A risk of $1,000 would simply require dividing the key numbers by 10
  • The entry and exit for each trade (futures/forex vs. the ETF) are made simultaneously – same date and time
  • The corresponding charts for each trade set up are shown

Note: This post will no doubt create some level of controversy and disagreement. This is my intent. I will stand by my position that trading an ETF tied to an underlying futures or forex market is a very foolish way to manage trading capital. I have no idea why a trader would ever trade a futures or forex-related ETF if he or she can handle the risk of the futures and forex markets. Let the facts of this document speak for themselves.


S&P 500 – Shorting the H&S top in May 2012


Trading Futures and Forex related ETF's Trading Futures and Forex related ETF's

Trading_Futures_and_Forex_related_ETF's_T1

Summary: Trading SPY ties up eight times more capital in a trade with a near-identical risk to reward profile. FOOLISH!

S&P 500 – Shorting the S&P top in May 2012 with an inverse ETF

Trading Futures and Forex related ETF's 3 Trading Futures and Forex related ETF's 4 Trading_Futures_and_Forex_related_ETF's_T2

Summary: Trading an inverse S&P ETF (SH) ties up eight times more capital in a trade with a near-identical risk to reward profile. FOOLISH!

British Pound – Buying the descending triangle bottom in August

Trading Futures and Forex related ETF's 5 Trading Futures and Forex related ETF's 6 Trading_Futures_and_Forex_related_ETF's_T3

Summary: Trading a long British Pound ETF (FXB) ties up 24-times more capital in a trade with a near-identical risk to reward profile. FOOLISH! REALLY FOOLISH! JUST PLAIN STUPID!


Gold – Buying the symmetrical triangle in August 2012

Trading Futures and Forex related ETF's Trading Futures and Forex related ETF's Trading_Futures_and_Forex_related_ETF's_T4

Summary: Trading a long Gold ETF (GLD) ties up nine times more capital in a trade with a near-identical risk to reward profile. FOOLISH!


Copper – Buying the 3-month -compound fulcrum bottom in September 2012

Trading Futures and Forex related ETF's Trading Futures and Forex related ETF's Trading_Futures_and_Forex_related_ETF's_T4

Summary: Trading a long Copper ETF (JJC) offered 25% more profit potential, but tied up eight times more capital in a trade with a near-identical risk profile. FOOLISH!


Summary

I could go on and on with these examples — to interest rate markets, grains, energy, food and fiber, every conceivable forex pair.

No matter how you stack it, using ETFs when underlying futures or forex contracts are available is an absolutely foolish utilization of trading capital.

With the sole of exceptions of having an account with too little capital to trade futures or an IRA or Roth account unable to use futures, why a person would trade GLD or SLV or SPY or any number of futures/forex-related ETFs in beyond my comprehension?

For the same risk per trade (expressed in dollars or as a percent of a trading account), futures/forex provide the following advantages:

  • More liquidity
  • Fewer overnight gaps
  • 24-hour trading access (in most cases)
  • Ability to hold far more different trades at the same time
  • Great punch per dollar employed to hold a trade – in fact, capital in futures is about eight to 10 times more efficient at an equal-risk level
  • Shorts in futures cannot be called back (as is the case with a short ETF position)

If you are a properly capitalized trader (I would saying anything north of $100,000 of non-IRA trading assets) you need to seriously challenge your use of ETFs instead of the underlying futures contract or forex cross.


PLB

###


Explaining the Dominant Fundamental Factor

Dominant Fundamental Factor

I have a theory about the U.S. stock market (and all other markets). I have no idea if I am right or wrong, but I believe with all my heart I am right.

The theory is that there is only one major fundamental or global macro factor (at the outside, maybe two) that drives a major trend in the U.S. stock market. I call this theory the “Dominant Fundamental Factor.

All the other apparently important fundamental factors just create confusion and market noise.

All day long we witness market “experts,” brokerage firm research analysts, the talking heads on CBNC and Bloomberg and participants in social media (Twitter, private chat rooms, et al) present this fundamental data or that fundamental data as the factors they feel should be driving market prices. In 95% of the cases, the fundamentals presented by these voices are unimportant — the facts may be correct, but the fundamentals behind the facts presented are not “market drivers.”

Traders and analysts develop the opinion that the things they focus on are really important drivers of price.

  • Cost of Silver production
  • Fed policy
  • Employment data
  • Consumer optimism
  • Factory production
  • Rail traffic
  • Earnings
  • Corporate, private and government debt trends
  • Inflows and outflows for mutual funds
  • Cost of Crude Oil
  • Trend in the U.S. Dollar
  • China — when in doubt, talk about China
  • Short interest
  • Price of Gold
  • Foreign competition
  • Technological advances
  • Corporate buy-backs
  • And on and on it goes

Some analysts believe that the market is driven by the composite of all the above factors and more — it is their job to put all the pieces together.

To the above idea, I say B___ S___!

History shows us that major trends in the U.S. stock market are driven by a Dominant Fundamental Factor — and that all the other fundamentals were throw aways during the course of said trends.

The challenge is to figure out what the Dominant Fundamental Factor is for a major trend — and to stay focused on it. The difficulty comes about because the next major trend will be driven by a different Dominant Fundamental Factor.

In the meanwhile, most traders and “talking heads” are pursuing knowledge of things that just do not matter.

Think about it:

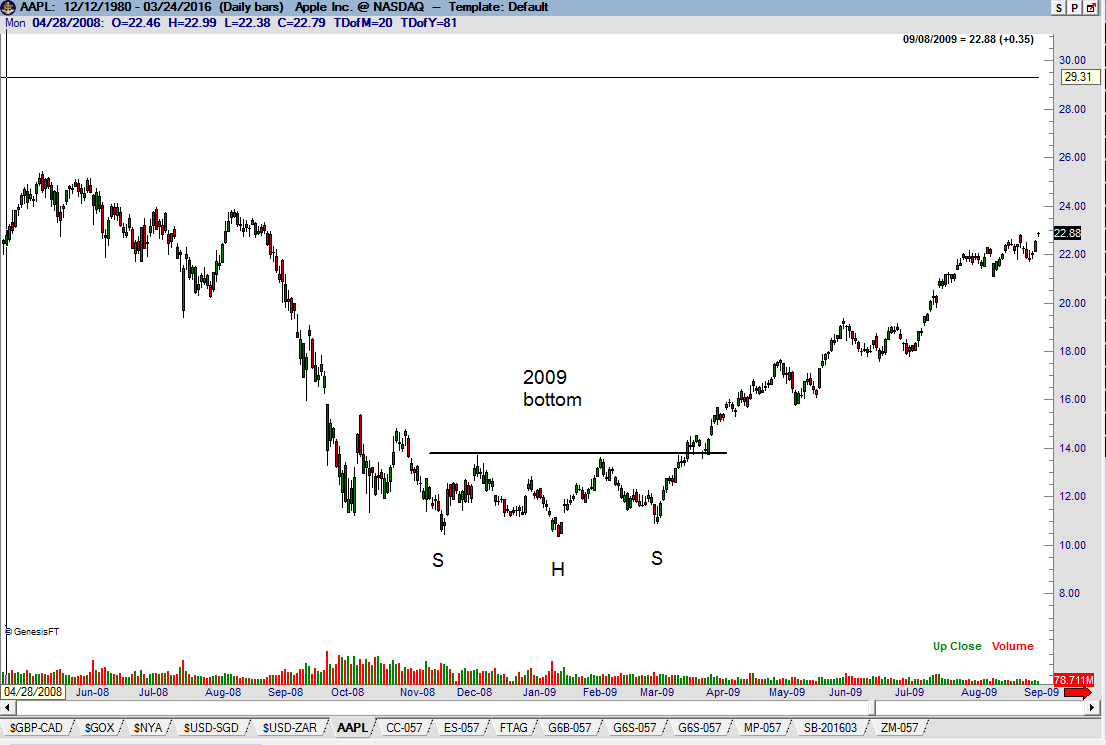
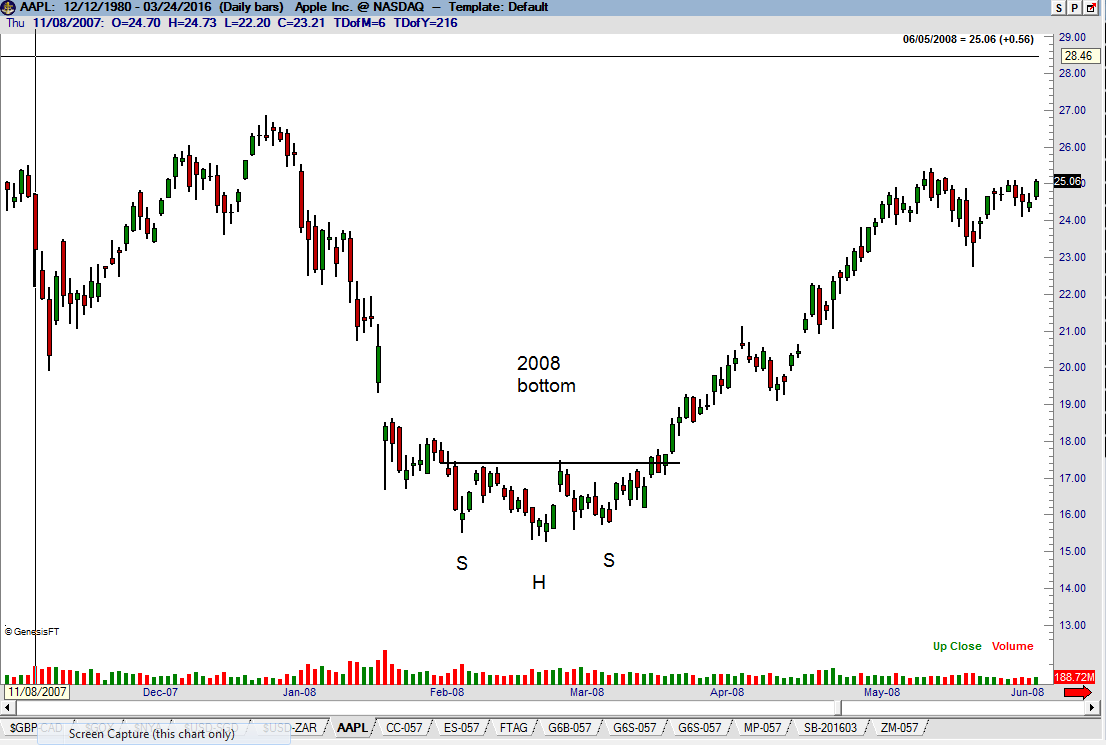
The market decline in Oct 2007 – Mar 2009 was driven by the mortgage crisis and related economic fall-out. Nothing else really mattered. The mortgage crisis was the Dominant Fundamental Factor. Focusing on anything else paid no dividend and only caused confusion.

The market turn-around from Mar 2009 through late 2011/early 2012 was driven by QE. A tidal wave of cash infusion overwhelmed every other global macro or fundamental element. QE was the Dominant Fundamental Factor. Focusing on anything else paid no dividend and only caused confusion.

The bull advance in U.S. stocks from early 2012 through late 2014 was driven by corporate earnings — and this was the Dominant Fundamental Factor. Focusing on anything else paid no dividend and only caused confusion.

I am not sure if there has been a Dominant Fundamental Factor driving the market from late 2014 through the present day — or perhaps, two Dominant Fundamental Factors have cancelled each other out (trend to NIRP vs. debt de-leveraging).

So, what will be the next Dominant Fundamental Factor. I am not sure, but I am sure of is this:

  • There will be a Dominant Fundamental Factor, and it will drive the market.
  • Traders who lock onto the single driver and do not become distracted will generate huge Alpha.
  • Many analysts (some very skilled and brilliant people) will insist the market is wrong because it is not paying attention to the NOT Dominant Fundamental Factors they claim should be the drivers of price.

I, for one, post many graphs and charts on Stock Twits and Twitter showing reasons why the U.S. stock market should be responding in a certain way. Yet, if the data shown by the graphs do not represent the Dominant Fundamental Factor, then the data is just noise. The graphs are still interesting fodder, but they do not have any real importance.

This brings me full circle back to why I am a chartist. I am not smart enough to determine what the Dominant Fundamental Factor is at any given point in time. I do not have the knowledge of global macro factors to make this determination. But, I trust that the charts will show me the way — and that I will learn of the Dominant Fundamental Factor after the fact.

Perhaps the Dominant Fundamental Factor beginning to play out is the global chase for yield. This is a possibility. If so, this will nullify all other global macro considerations.

Many very smart people are pointing to the eventual outcome of global NIRP. We have never had negative interest rates like we are experiencing. There will be a huge price to pay for the reckless endeavors of global central bankers. Eventually the side effects of NIRP will be the Dominant Fundamental Factor. But I do not know when, or how things will play out.

Anyway, that is my two cents — and that is what my opinion is probably worth.

plb

###


Webinar – Factor Trading

This content is for members only
Trading commentary

Losing to Win


Losing to Win – Trading Commentary

I sometimes sense from email correspondence I receive from the Factor community that there is an obsession in being “Right” when trading or put another way, concern that their analysis might be “wrong.”

Running the risk of offending, this worry about being right or wrong on a trade or an analysis puts up a major red flag in my mind.

I learned early on at the Chicago Board of Trade that the road to long-term profits runs through the city of Losses.

Worry or concern that a trade will be a loser is a major hurdle to profitability.

Professional traders understand that the goal of trading is to make money, not to be right. Making money in the markets requires losses — a lot of losses. Most traders I know are right no more than 40% or 50% of the time — this means they are wrong and take losses on 50% to 60% of their trades. Being wrong is part of trading. It comes with the territory. My default frame of mind as I enter any trade is that it will be a loser.

One of the major mistakes made by novice traders is that their bet size is much too large — often they risk 5%, 10%, or more of their capital on an individual trade. At this bet level I, too, would be worried about being wrong. Betting 10% of your capital on each trade is a sure way to wipe out your trading account. Someday I will explain why statistical probability will lead to ruin, but not today.

It is the fear of losses that leads many novice traders in search of holy grail trading systems that promise to be right on 80% or more of the time. Good luck with that one. If you are in possession of such a system and it delivers on the promise, then you are smarter than am I.

If the fear of losing characterizes your trading, then I offer a couple of thoughts.

First, settle on how you plan to trade and handle risk management, then paper trade for a year or so.

Second, when you begin to trade real money, risk no more than 30 to 50 basis points on each trade.

Third, if you have too small of an account to permit a risk as little as 50 BP, then you might think about endeavors other than trading.

There is a fine line between being fearful of the markets and having well-deserved respect for how much damage the markets can deliver to carelessness. You need to be on one side of this spectrum or the other. Being on the side of fearfulness is something that can be overcome — and that is the good news.

See the home page for details regarding Factor Membership options: https://www.peterlbrandt.com

plb

###

Factor Alert – March 30th


Factor Alert – March 30th

There are a few charts of interest developing this week.
New Zealand Dollar. This chart appears to be completing a common bottom on the weekly and daily graphs. A decisive close above the Oct 2015 high would complete this base area and establish a target of .7470, although resistance should be expected at the Feb 2015 low of .7147. This is a possible Factor Move.

NOTE:  This is a sample report that members of Peter Brandt’s Factor Service receive on a weekly basis.  To consider membership, please visit this page for further details:  Factor Membership Option

1
2
USD/SEK. The 14-month rectangle continues to develop on the weekly graph. I have not ruled out a downside breakout. Note that the rally in recent days retested the under belly of a 5-month rectangle on the daily graph (red box). This is the type of chart construction that offers me the opportunity to establish an anticipatory position, although there is always the danger of being whipsawed within a trading range.
3
4
Japanese Yen. My bias in the Yen is well advertised. The bull trap of Mar 17 needs to be resolved. The question is whether the weak longs established with the false breakout of the 6-week rectangle on the daily graph have been adequately washed out. The long-term trend in Yen futures remains up.
5
U.S. Treasuries. The weekly continuation chart in T-Bonds appears to be a completed symmetrical triangle whereby the recent decline was simply a retest. The daily graph of June Bonds has completed a bullish wedge as well as a small 4-week H&S bottom. This is a Factor Move pending a firm close this week. The daily chart of the 10-Yr. Notes has completed a well-defined, but small, H&S bottom.
6
7
8
Sugar. The decline this week may become the retest of the underling base in May Sugar.
9
Crude Oil. I am not surprised by the decline today in Crude. It is difficult for me to be constructive on the charts, even though the weekly graph has completed a sizable falling wedge (not shown). I have no present interest in trade WTI.
10
Eurocurrency. Long-time Factor members are well aware of the January Effect in the EUR/USD crossrate.  It is possible that the Jan 2016 low will qualify as the annual low. If so, EUR/USD could advance toward major resistance at 1.2000.
11
Just a word of warning is in order. The signals in Bonds, USDSEK, NZD and Sugar look quite promising. Yet, I continue to view the current markets as choppy. I remain committed to assuming under-leveraged positions in well-defined chart signals.

NOTE:  This is a sample report that members of Peter Brandt’s Factor Service receive on a weekly basis.  To consider membership, please visit this page for further details:  Factor Membership Option


plb
###
Stock market trading - Trading commentary

Trading Commentary — A day late, a dollar short


Trading Commentary — A day late, a dollar short

The comments herein are not applicable to all traders. But to those for whom they are applicable, you will know it.

Four part question:

1    Have you ever had a strong feeling that a  market was about to do a certain thing? As an example, let’s say you had a strong feeling the S&Ps were about to rally 30 big points.

2    Next, have you ever then jumped into the market AFTER it started doing what you expected it to do? As an example, let’s say you bought the S&Ps after it rallied 20 points.

3    Next, have you ever then been spooked out of the trade you chased on the first adverse reaction against your position. Going back to our example, you chased a 20 point rally in the S&Ps, then got shaken out on a 10 point reaction.

4    Next, have you ever then watched the market complete the move you expected without having a position?

In the example above, you expected the S&Ps to rally 30 points — the S&Ps rallied 30 points, but you lost 10 points in the process.

This is where trading regret comes into the formula. This is where one mistake can beget the next mistake.

So, what is the solution? I offer one of two suggestions.

First, you learn to pull the trigger when you should. Most traders with two or more years of experience know what they need to do to be successful. The problem is doing it.

Second, if you do not take a trade when you should take it, you MUST learn to stay on the sidelines. There will always be another trade.

If the above four-part scenario represents a  cycle you are caught in, you will NOT make it as a trader. Fear is a trader’s enemy.

  • You fear your market instincts or trading rules may be wrong, so you do not pull the trigger when it should be pulled.
  • You fear you are missing a move you predicted, so you jump in a day late.
  • You worry you entered the market too late, so you get shaken out on the first adverse reaction.

Trading success has little to finding a better mousetrap to predict price movement. Trading success has little to do with obtaining better trading technology.

Trading success is a battle fought in one’s head and gut. Trading success is a matter of overcoming self. A trader is his or her own worst enemy. You have met the enemy — it is you. I have met the enemy — it is me.

Once you have enough experience trading, you know full well when you do something stupid. You know when you are making a mistake at the time you are making the mistake.


plb

###