

Crude Oil Descending
Crude Oil Descending
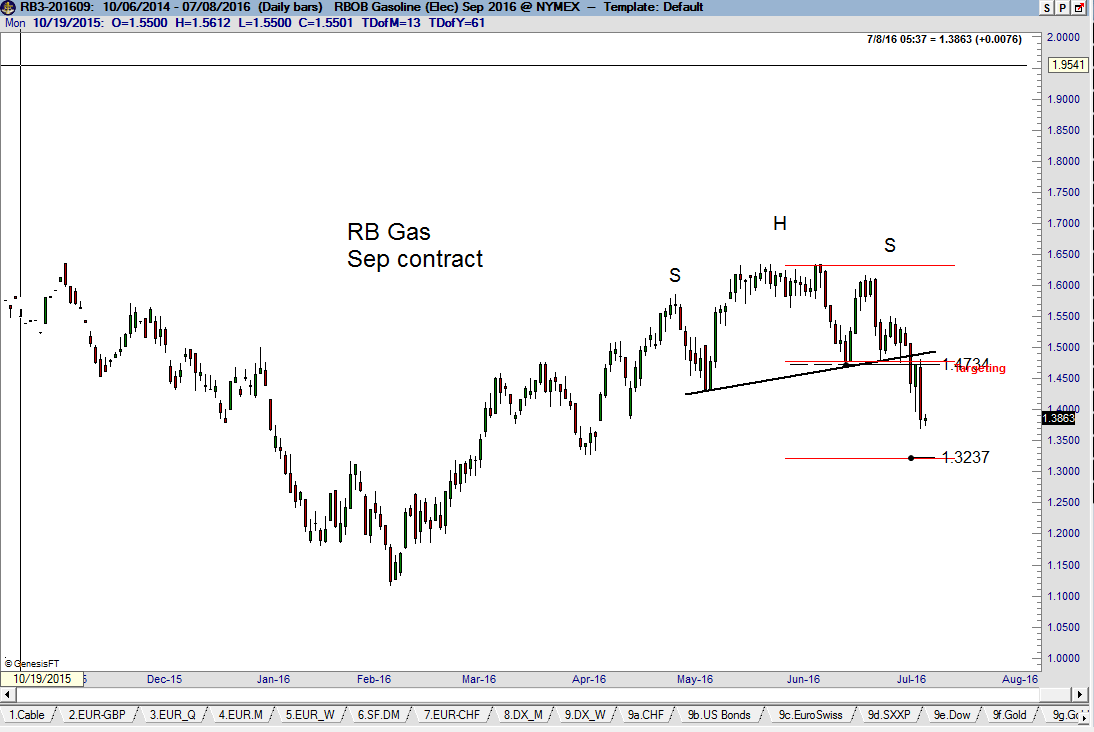
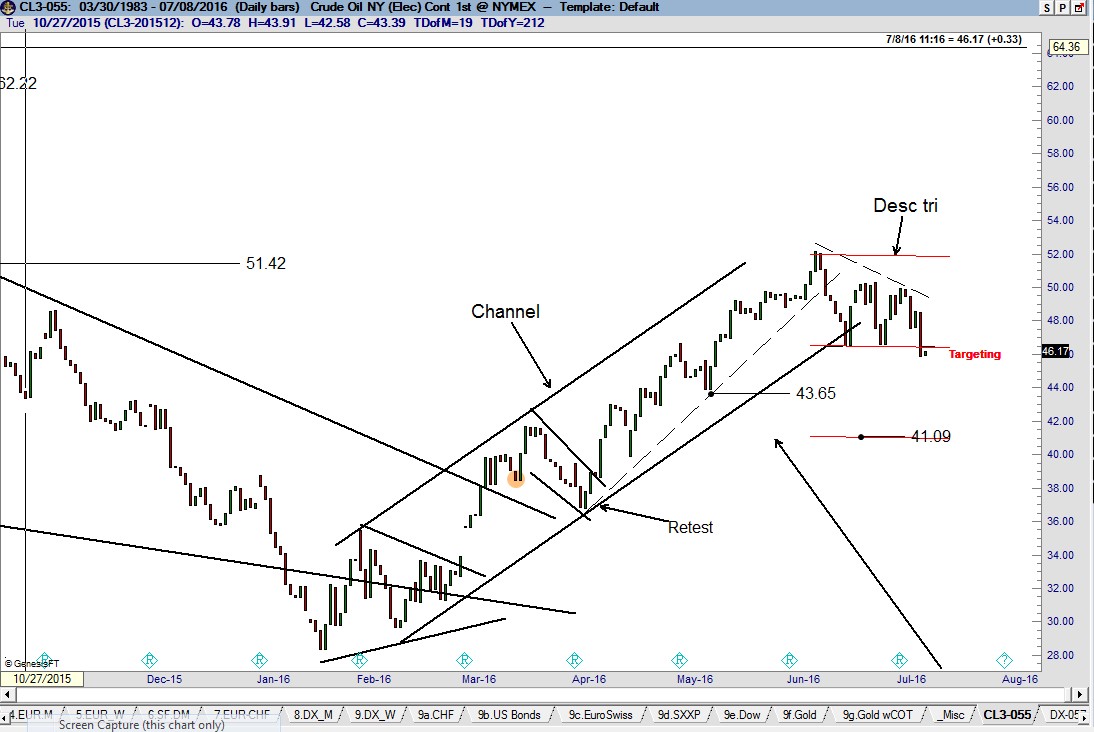
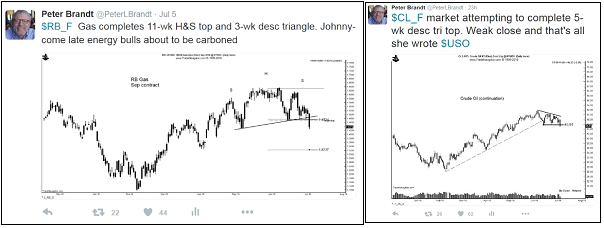
Crude Oil is descending out of a triangle pattern. The daily graphs show clear signs of topping in the energy markets. The daily graph of Sep RB Gas has completed an 11-week H&S top pattern with a target of 1.3237.
A couple of observations on daily continuation graph (true range) of Crude Oil are worthy of note. First, the 5-month up channel from the late Jan lows has been clearly violated. The breaking of an advancing trendline (lower boundary of a channel) is never a bearish signal in and of itself. Trendline breaks are simply an indication that the behavior of a market is changing. Second, the Crude Oil decline on Jul 7 completed a small descending triangle top with a target of 43.65, then 41.09. Factor is short Crude Oil.
Factor Membership is now available where trade setups such as Crude Oil are just one of numerous themes in focus each week. You could consider your membership in the Factor Service as just one more trade. If the Factor Service is not of value to you, well, it is just one more trade that did not work. Through the Factor Service I endeavor to alert novice and aspiring traders to the many pitfalls you will face – and to offer advice on overcoming those pitfalls. My goal is to shoot straight on what trading is all about. For more information watch my 30 minute webinar where we cover the Factor service in depth.
I hope you will consider joining the Factor community.


